Oxford Cambridge and RSA
Wednesday 18 June 2025 – Morning
A Level Biology B (Advancing Biology)
H422/03 Practical skills in biology
Time allowed: 1 hour 30 minutes
You must have:
* 1 8 4 8 1 5 4 2 4 8 *
• a ruler (cm/mm)
You can use:
• a scientific or graphical calculator
* H 4 2 2 0 3 *
Please write clearly in black ink. Do not write in the barcodes.
Centre number Candidate number
First name(s)
Last name
INSTRUCTIONS
• Use black ink. You can use an HB pencil, but only for graphs and diagrams.
• Write your answer to each question in the space provided. If you need extra space use
the lined pages at the end of this booklet. The question numbers must be clearly shown.
• Answer all the questions.
• Where appropriate, your answer should be supported with working. Marks might be
given for using a correct method, even if your answer is wrong.
INFORMATION
• The total mark for this paper is 60.
• The marks for each question are shown in brackets [ ].
• Quality of extended response will be assessed in questions marked with an asterisk (*).
• This document has 20 pages.
ADVICE
• Read each question carefully before you start your answer.
© OCR 2025 [601/4720/9] OCR is an exempt Charity
DC (DE/JG) 346850/3 Turn over
for more: tyrionpapers.com
, 2
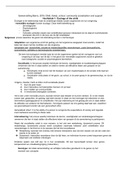
1 Two functions of the roots of plants are to take up water from the soil and to store starch.
(a) The photomicrograph shows a transverse section of a root in a monocotyledonous plant.
A
C
B
× 20
(i) The cells labelled A and B are two different types of cell in the vascular tissue of the root.
Identify the types of cell labelled A and B.
A .......................................................................................................................................................
B .......................................................................................................................................................
[2]
(ii) The diameter of one region of the root is represented by the line C in the image.
The magnification used to produce the image was × 20.
Calculate the actual diameter of C.
Give your answer in mm.
Diameter = ................................................... mm [2]
(iii) One risk when dissecting plant tissues, such as roots, is the potential for injury when using sharp
instruments.
State one other health and safety risk that should be considered before dissecting plant tissues.
..........................................................................................................................................................
..................................................................................................................................................... [1]
© OCR 2025
for more: tyrionpapers.com
, 3
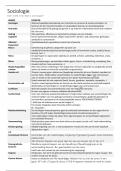
(b) A scientist investigates how the rate of water uptake by roots is affected by the presence of salt
(NaCl) in the surrounding soil.
This is the method they use:
• Grow 110 tomato plants in pots of soil in a greenhouse.
• Add 50 mmol dm–3 salt solution to the soil of 55 plants, every day.
• The other 55 plants are a control group.
• Calculate the rate of water uptake per day (dm3 d–1) by the roots of each plant.
The results of the investigation are shown in the graph.
2.5
Key:
control
salt solution
2.0
Mean 1.5
rate of
water
uptake
1.0
(dm3 d–1)
0.5
0.0
0 20 40 60 80 100 120 140 160
Time (days)
(i) State how the group of control plants would be set up differently to the group of plants given salt
solution and explain the purpose of this control group.
..........................................................................................................................................................
..........................................................................................................................................................
..........................................................................................................................................................
..................................................................................................................................................... [2]
(ii) Calculate the largest percentage difference in water uptake between the plants in the control
group and the plants given salt solution.
Use your answer to complete the sentence.
On day ............................. the water uptake of the control plants was .............................% greater
than the water uptake of the plants given the salt solution. [2]
© OCR 2025 Turn over
for more: tyrionpapers.com
, 4
(iii) Suggest what conclusions can be made from the results shown in the graph.
..........................................................................................................................................................
..........................................................................................................................................................
..........................................................................................................................................................
..........................................................................................................................................................
..................................................................................................................................................... [2]
(c) The roots of plants can store starch in high concentrations.
Outline how the starch concentration of a sample of root tissue could be estimated using
colorimetry.
..........................................................................................................................................................
..........................................................................................................................................................
..........................................................................................................................................................
..........................................................................................................................................................
..........................................................................................................................................................
..........................................................................................................................................................
..........................................................................................................................................................
..........................................................................................................................................................
..........................................................................................................................................................
..................................................................................................................................................... [4]
© OCR 2025
for more: tyrionpapers.com
Wednesday 18 June 2025 – Morning
A Level Biology B (Advancing Biology)
H422/03 Practical skills in biology
Time allowed: 1 hour 30 minutes
You must have:
* 1 8 4 8 1 5 4 2 4 8 *
• a ruler (cm/mm)
You can use:
• a scientific or graphical calculator
* H 4 2 2 0 3 *
Please write clearly in black ink. Do not write in the barcodes.
Centre number Candidate number
First name(s)
Last name
INSTRUCTIONS
• Use black ink. You can use an HB pencil, but only for graphs and diagrams.
• Write your answer to each question in the space provided. If you need extra space use
the lined pages at the end of this booklet. The question numbers must be clearly shown.
• Answer all the questions.
• Where appropriate, your answer should be supported with working. Marks might be
given for using a correct method, even if your answer is wrong.
INFORMATION
• The total mark for this paper is 60.
• The marks for each question are shown in brackets [ ].
• Quality of extended response will be assessed in questions marked with an asterisk (*).
• This document has 20 pages.
ADVICE
• Read each question carefully before you start your answer.
© OCR 2025 [601/4720/9] OCR is an exempt Charity
DC (DE/JG) 346850/3 Turn over
for more: tyrionpapers.com
, 2
1 Two functions of the roots of plants are to take up water from the soil and to store starch.
(a) The photomicrograph shows a transverse section of a root in a monocotyledonous plant.
A
C
B
× 20
(i) The cells labelled A and B are two different types of cell in the vascular tissue of the root.
Identify the types of cell labelled A and B.
A .......................................................................................................................................................
B .......................................................................................................................................................
[2]
(ii) The diameter of one region of the root is represented by the line C in the image.
The magnification used to produce the image was × 20.
Calculate the actual diameter of C.
Give your answer in mm.
Diameter = ................................................... mm [2]
(iii) One risk when dissecting plant tissues, such as roots, is the potential for injury when using sharp
instruments.
State one other health and safety risk that should be considered before dissecting plant tissues.
..........................................................................................................................................................
..................................................................................................................................................... [1]
© OCR 2025
for more: tyrionpapers.com
, 3
(b) A scientist investigates how the rate of water uptake by roots is affected by the presence of salt
(NaCl) in the surrounding soil.
This is the method they use:
• Grow 110 tomato plants in pots of soil in a greenhouse.
• Add 50 mmol dm–3 salt solution to the soil of 55 plants, every day.
• The other 55 plants are a control group.
• Calculate the rate of water uptake per day (dm3 d–1) by the roots of each plant.
The results of the investigation are shown in the graph.
2.5
Key:
control
salt solution
2.0
Mean 1.5
rate of
water
uptake
1.0
(dm3 d–1)
0.5
0.0
0 20 40 60 80 100 120 140 160
Time (days)
(i) State how the group of control plants would be set up differently to the group of plants given salt
solution and explain the purpose of this control group.
..........................................................................................................................................................
..........................................................................................................................................................
..........................................................................................................................................................
..................................................................................................................................................... [2]
(ii) Calculate the largest percentage difference in water uptake between the plants in the control
group and the plants given salt solution.
Use your answer to complete the sentence.
On day ............................. the water uptake of the control plants was .............................% greater
than the water uptake of the plants given the salt solution. [2]
© OCR 2025 Turn over
for more: tyrionpapers.com
, 4
(iii) Suggest what conclusions can be made from the results shown in the graph.
..........................................................................................................................................................
..........................................................................................................................................................
..........................................................................................................................................................
..........................................................................................................................................................
..................................................................................................................................................... [2]
(c) The roots of plants can store starch in high concentrations.
Outline how the starch concentration of a sample of root tissue could be estimated using
colorimetry.
..........................................................................................................................................................
..........................................................................................................................................................
..........................................................................................................................................................
..........................................................................................................................................................
..........................................................................................................................................................
..........................................................................................................................................................
..........................................................................................................................................................
..........................................................................................................................................................
..........................................................................................................................................................
..................................................................................................................................................... [4]
© OCR 2025
for more: tyrionpapers.com