Week 4 Test
Your work has been saved and submitted
Your work has been saved and submitted
Written Nov 25, 2025 10:23 AM - Nov 25, 2025 11:07 AMAttempt 1 of 2
- 9
Attempt Score
5%
- 9
Overall Grade (Highest Attempt)
5%
Question 1 point
The size of fish is very important to commercial fishing. A study conducted in 2012
found the length of Atlantic cod caught in nets in Karlskrona to have a mean of
47.8 cm and a standard deviation of 3.72 cm (Ovegard, Berndt & Lunneryd, 2012).
Assume the length of fish is normally distributed. What is the length in cm of the
longest 10% of Atlantic cod in this area? Round answer to 2 decimal places.
Answer:
52.57
Hide question 1 feedback
Feedback
Longest 10% is in the 90th percentile.
In Excel,
=NORM.INV(.90,47.8,3.72)
Question 2 point
Find the area under the standard normal distribution to the left of z = -1.35. Round
answer to 4 decimal places. Answer:
0.0885
Hide question 2 feedback
Feedback
In Excel,
, =NORM.S.DIST(-1.35,TRUE)
Question 3 point
The mean yearly rainfall in Sydney, Australia, is about 134 mm and the standard
deviation is about 66 mm ("Annual maximums of," 2013). Assume rainfall is
normally distributed. How many yearly mm of rainfall would there be in the top
15%? Round answer to 2 decimal places. Answer:
202.40
Hide question 3 feedback
Feedback
Top 15%, is in the bottom 85% percentile.
In Excel,
=NORM.INV(.85,134,66)
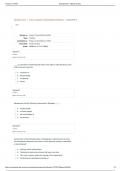
Question 4 point
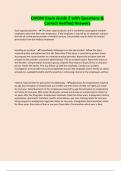
Which type of distribution does the graph illustrate?
Poisson Distribution
Right skewed Distribution
Your work has been saved and submitted
Your work has been saved and submitted
Written Nov 25, 2025 10:23 AM - Nov 25, 2025 11:07 AMAttempt 1 of 2
- 9
Attempt Score
5%
- 9
Overall Grade (Highest Attempt)
5%
Question 1 point
The size of fish is very important to commercial fishing. A study conducted in 2012
found the length of Atlantic cod caught in nets in Karlskrona to have a mean of
47.8 cm and a standard deviation of 3.72 cm (Ovegard, Berndt & Lunneryd, 2012).
Assume the length of fish is normally distributed. What is the length in cm of the
longest 10% of Atlantic cod in this area? Round answer to 2 decimal places.
Answer:
52.57
Hide question 1 feedback
Feedback
Longest 10% is in the 90th percentile.
In Excel,
=NORM.INV(.90,47.8,3.72)
Question 2 point
Find the area under the standard normal distribution to the left of z = -1.35. Round
answer to 4 decimal places. Answer:
0.0885
Hide question 2 feedback
Feedback
In Excel,
, =NORM.S.DIST(-1.35,TRUE)
Question 3 point
The mean yearly rainfall in Sydney, Australia, is about 134 mm and the standard
deviation is about 66 mm ("Annual maximums of," 2013). Assume rainfall is
normally distributed. How many yearly mm of rainfall would there be in the top
15%? Round answer to 2 decimal places. Answer:
202.40
Hide question 3 feedback
Feedback
Top 15%, is in the bottom 85% percentile.
In Excel,
=NORM.INV(.85,134,66)
Question 4 point
Which type of distribution does the graph illustrate?
Poisson Distribution
Right skewed Distribution