Lecture 1 Measurement Article: Hult et al.
Measurement
Relationship between the numbers and what is being measured. Different types of
measures/data sources leads to different results.
Basic issues in measurement
Validity
Extent to which a measure correctly represents the concepts of study (link between the
measure that you choose and the concept that you study). For example, you want to study a
person’s net income, but you choose to measure the net income per household.
Internal validity how well the study was done (do you have good questionnaire?)
External validity generalize results to other situations (can you transfer your study to
another country/other situations?)
Accuracy: measure close to actual value / getting the ‘right’ answer on average
Reliability/consistency
Extent to which a variable is consistent in what it is intended to measure. For example,
conduct the same study twice – will the results be the same?
Organizing your data
Your data can be:
- Cross-sectional: observations at a given point in time (snapshot of what is happening)
- Time series
- Panel (longitudinal): observations over a period of time (days/months/years). Combines cross-
sectional and time series data.
Paper of Hult et al.
key: the way you measure determines your results (see slides for more info)
The abstract of the paper always captures the main findings of the research – so write an attractive
one!
Questions the researcher has to deal with:
1. Type of data source: primary/secondary
2. Type of measure: e.g. financial performance/operational performance/overall effectiveness
3. Level of analysis: e.g. firm level/business unit/inter-organizational unit level
Selection bias representativity of your sample
If your sample is not representative. e.g. only taking a sample of large firms or firms that adopt
harmonized accounting standards. These firms are fundamentally different than others so your
interpretation of your results/conclusions can be very different. Or you are looking at only
high-income countries, you cannot generalize your results you are leaving out the lower
income countries. It is not representative anymore. Only if you have chosen to focus on a
certain group beforehand!
Endogeneity
Correlation between regressor x and error term e. There are three reasons why it takes place:
measurement error (e.g. questionnaire with people mistakes/people can answer wrong
accidently or not honest or when you are coding your data, you can make a mistake), omitted
variable bias (when you left out your analysis an important independent variable) and/or
reverse causality (normally x affects y but now it is reversed).
, Lecture 2 Descriptive statistics Article: Aybar & Ficici
Measurement levels
Nominal: number only tells the category, no ranking. Binary measurement level is when there are two
distinct categories (yes/no)
Ordinal: ordered categories (logical order)
Interval: information about differences between point on a scale, equal intervals represent equal
differences. E.g.: Celsius scale (can go into minus)
Ratio: same as interval but it has an absolute zero (e.g. age/weight, cannot go into minus and the zero
does not really mean anything)
Descriptive statistics/summary statistics
Is step 1 in research, just a summary before the actual analysis. Quantitative description of main
features of data. Gives you information about:
Which are the players of the game?
Which is the nature of the variables? (e.g. discrete, continuous)
Do you see any problems? Things to keep in mind? (e.g. min/max/negative values)
You will get a general view of your data
Which are the summary statistics one can calculate?
1. Number of observations
2. Measures of central tendency (mean/median/mode)
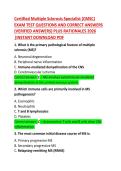
3. Skewness: about the shape of a distribution specifically about the symmetry of a
distribution compared to a normal distribution
When your distribution is not skewed mean
When your distribution is skewed median
If the skewness is not separately shown, you could compare the mean and the median. If the
mean is larger than the median = positively skewed
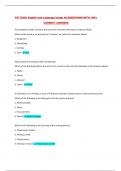
4. Kurtosis: also says something about the shape of a distribution specifically about the degree
to which scores cluster at the tails compared to the normal distribution (in points):
Kurtosis = 3 is assumed as a normal distribution (in SPSS this number is 0)
Leptokurtic > 3 heavy tails, maybe also pointy distribution
Platykurtic < 3 light tails, maybe also flatter distribution
5. Minimum and maximum = range (max minus min)
Can also be stated as interquartile range (Q1 lower quartile = 25%, Q3 upper quartile = 75%)
6. Variance and standard deviation
Standard deviation tells you how spread out the data are from the mean + heterogeneity of the
sample
Measure of association
Sometimes part of summary statistics
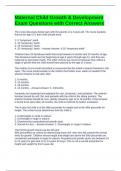
Correlation/correlation coefficient strength of the relationship between two variables (positive or
negative, from -1 to +1. Equal to zero = no linear relationship = as one variable changes, the other
stays the same. You always have to interpret correlation on size (degree of correlation), sign (positive
or negative) and significance. Correlation is NOT causation & you do not know if there is a 3 rd
variable that affects variable 1 and 2 for example that leads to the correlation between 1 and 3.
Lecture 3 OLS Regression
Measurement
Relationship between the numbers and what is being measured. Different types of
measures/data sources leads to different results.
Basic issues in measurement
Validity
Extent to which a measure correctly represents the concepts of study (link between the
measure that you choose and the concept that you study). For example, you want to study a
person’s net income, but you choose to measure the net income per household.
Internal validity how well the study was done (do you have good questionnaire?)
External validity generalize results to other situations (can you transfer your study to
another country/other situations?)
Accuracy: measure close to actual value / getting the ‘right’ answer on average
Reliability/consistency
Extent to which a variable is consistent in what it is intended to measure. For example,
conduct the same study twice – will the results be the same?
Organizing your data
Your data can be:
- Cross-sectional: observations at a given point in time (snapshot of what is happening)
- Time series
- Panel (longitudinal): observations over a period of time (days/months/years). Combines cross-
sectional and time series data.
Paper of Hult et al.
key: the way you measure determines your results (see slides for more info)
The abstract of the paper always captures the main findings of the research – so write an attractive
one!
Questions the researcher has to deal with:
1. Type of data source: primary/secondary
2. Type of measure: e.g. financial performance/operational performance/overall effectiveness
3. Level of analysis: e.g. firm level/business unit/inter-organizational unit level
Selection bias representativity of your sample
If your sample is not representative. e.g. only taking a sample of large firms or firms that adopt
harmonized accounting standards. These firms are fundamentally different than others so your
interpretation of your results/conclusions can be very different. Or you are looking at only
high-income countries, you cannot generalize your results you are leaving out the lower
income countries. It is not representative anymore. Only if you have chosen to focus on a
certain group beforehand!
Endogeneity
Correlation between regressor x and error term e. There are three reasons why it takes place:
measurement error (e.g. questionnaire with people mistakes/people can answer wrong
accidently or not honest or when you are coding your data, you can make a mistake), omitted
variable bias (when you left out your analysis an important independent variable) and/or
reverse causality (normally x affects y but now it is reversed).
, Lecture 2 Descriptive statistics Article: Aybar & Ficici
Measurement levels
Nominal: number only tells the category, no ranking. Binary measurement level is when there are two
distinct categories (yes/no)
Ordinal: ordered categories (logical order)
Interval: information about differences between point on a scale, equal intervals represent equal
differences. E.g.: Celsius scale (can go into minus)
Ratio: same as interval but it has an absolute zero (e.g. age/weight, cannot go into minus and the zero
does not really mean anything)
Descriptive statistics/summary statistics
Is step 1 in research, just a summary before the actual analysis. Quantitative description of main
features of data. Gives you information about:
Which are the players of the game?
Which is the nature of the variables? (e.g. discrete, continuous)
Do you see any problems? Things to keep in mind? (e.g. min/max/negative values)
You will get a general view of your data
Which are the summary statistics one can calculate?
1. Number of observations
2. Measures of central tendency (mean/median/mode)
3. Skewness: about the shape of a distribution specifically about the symmetry of a
distribution compared to a normal distribution
When your distribution is not skewed mean
When your distribution is skewed median
If the skewness is not separately shown, you could compare the mean and the median. If the
mean is larger than the median = positively skewed
4. Kurtosis: also says something about the shape of a distribution specifically about the degree
to which scores cluster at the tails compared to the normal distribution (in points):
Kurtosis = 3 is assumed as a normal distribution (in SPSS this number is 0)
Leptokurtic > 3 heavy tails, maybe also pointy distribution
Platykurtic < 3 light tails, maybe also flatter distribution
5. Minimum and maximum = range (max minus min)
Can also be stated as interquartile range (Q1 lower quartile = 25%, Q3 upper quartile = 75%)
6. Variance and standard deviation
Standard deviation tells you how spread out the data are from the mean + heterogeneity of the
sample
Measure of association
Sometimes part of summary statistics
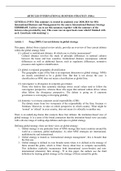
Correlation/correlation coefficient strength of the relationship between two variables (positive or
negative, from -1 to +1. Equal to zero = no linear relationship = as one variable changes, the other
stays the same. You always have to interpret correlation on size (degree of correlation), sign (positive
or negative) and significance. Correlation is NOT causation & you do not know if there is a 3 rd
variable that affects variable 1 and 2 for example that leads to the correlation between 1 and 3.
Lecture 3 OLS Regression