2025 Pearson Edexcel Level 1/Level 2 GCSE (9–1) Statistics PAPER 1
Higher Tier Combined Question Paper and Marking Scheme
Please check the examination details below before entering your candidate information
Candidate surname Other names
Centre Number Candidate Number
Pearson Edexcel Level 1/Level 2 GCSE (9–1)
Monday 2 June 2025
Morning (Time: 1 hour 30 minutes) Paper
reference 1ST0/1H
Statistics
PAPER 1
Higher Tier
You must have: Total Marks
Ruler graduated in centimetres and millimetres, protractor,
pair of compasses, pen, HB pencil, eraser, scientific calculator.
Instructions
•• Use black ink or ball‑point pen.
Fill in the boxes at the top of this page with your name,
centre number and candidate number.
•• Answer all questions.
Answer the questions in the spaces provided
– there may be more space than you need.
• Scientific calculators may be used.
• You must show all your working out with your answer clearly identified
at the end of your solution.
Information
•• The total mark for this paper is 80.
The marks for each question are shown in brackets
– use this as a guide as to how much time to spend on each question.
Advice
• Read each question carefully before you start to answer it.
• Check
Try to answer every question.
• your answers if you have time at the end.
Turn over
P76385A
©2025 Pearson Education Ltd.
Y:1/1/1/1/
, Higher Tier Formulae
You must not write on this page.
DO NOT WRITE IN THIS AREA
Anything you write on this page will gain NO credit.
3(mean median)
Skew =
standard deviation
1
Standard deviation =
n
(x x )2
An alternative formula for standard deviation is
2
x2 x
standard deviation =
n n
DO NOT WRITE IN THIS AREA
Spearman’s rank correlation coefficient
6d 2
rs 1
n(n2 1)
number of births 1000
Rates of change (e.g. Crude birth rate = )
total population
DO NOT WRITE IN THIS AREA
2
, Answer ALL the questions.
Write your answers in the spaces provided.
DO NOT WRITE IN THIS AREA
You must write down all the stages in your working.
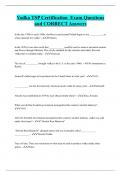
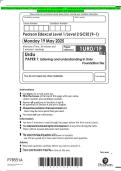
1 Rebecca collected data from the internet about the litter size of wild boar in France and
in Italy.
The frequency polygons give information about the litter sizes.
70
60
50
40
Frequency
30
France
20
DO NOT WRITE IN THIS AREA
10 Italy
0
1 2 3 4 5 6 7 8 9 10
Litter size
(Source: www.academic.oup.com and www.researchgate.net)
Rebecca concludes that the average wild boar litter size in France is bigger than in Italy.
(a) Do the frequency polygons support Rebecca’s conclusion?
Give a reason for your answer.
..................................................................................................................................................................................................................................................
..................................................................................................................................................................................................................................................
(1)
(b) Give another comparison of the distributions of the wild boar litter sizes in France
DO NOT WRITE IN THIS AREA
and in Italy.
..................................................................................................................................................................................................................................................
..................................................................................................................................................................................................................................................
(1)
(c) Discuss how the data collection could reduce the reliability of these conclusions.
..................................................................................................................................................................................................................................................
..................................................................................................................................................................................................................................................
(1)
(Total for Question 1 is 3 marks)
3
Turn over
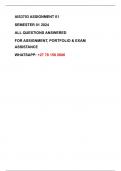
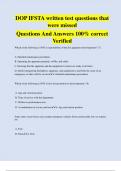
, 2 The choropleth map gives information about the percentage change in the mileage
driven in Great Britain for each region from 2020 to 2021
DO NOT WRITE IN THIS AREA
Percentage change in mileage driven in 2020 to 2021
Key:
<10
10–12
12–13
Scotland
DO NOT WRITE IN THIS AREA
13–14
≥14
North East
England
Yorkshire and
North West the Humber
England
East
Midlands
West
East of
Midlands
DO NOT WRITE IN THIS AREA
England
Wales
South East
South West
England London
England
(Source: https://roadtraffic.dft.gov.uk)
4
Higher Tier Combined Question Paper and Marking Scheme
Please check the examination details below before entering your candidate information
Candidate surname Other names
Centre Number Candidate Number
Pearson Edexcel Level 1/Level 2 GCSE (9–1)
Monday 2 June 2025
Morning (Time: 1 hour 30 minutes) Paper
reference 1ST0/1H
Statistics
PAPER 1
Higher Tier
You must have: Total Marks
Ruler graduated in centimetres and millimetres, protractor,
pair of compasses, pen, HB pencil, eraser, scientific calculator.
Instructions
•• Use black ink or ball‑point pen.
Fill in the boxes at the top of this page with your name,
centre number and candidate number.
•• Answer all questions.
Answer the questions in the spaces provided
– there may be more space than you need.
• Scientific calculators may be used.
• You must show all your working out with your answer clearly identified
at the end of your solution.
Information
•• The total mark for this paper is 80.
The marks for each question are shown in brackets
– use this as a guide as to how much time to spend on each question.
Advice
• Read each question carefully before you start to answer it.
• Check
Try to answer every question.
• your answers if you have time at the end.
Turn over
P76385A
©2025 Pearson Education Ltd.
Y:1/1/1/1/
, Higher Tier Formulae
You must not write on this page.
DO NOT WRITE IN THIS AREA
Anything you write on this page will gain NO credit.
3(mean median)
Skew =
standard deviation
1
Standard deviation =
n
(x x )2
An alternative formula for standard deviation is
2
x2 x
standard deviation =
n n
DO NOT WRITE IN THIS AREA
Spearman’s rank correlation coefficient
6d 2
rs 1
n(n2 1)
number of births 1000
Rates of change (e.g. Crude birth rate = )
total population
DO NOT WRITE IN THIS AREA
2
, Answer ALL the questions.
Write your answers in the spaces provided.
DO NOT WRITE IN THIS AREA
You must write down all the stages in your working.
1 Rebecca collected data from the internet about the litter size of wild boar in France and
in Italy.
The frequency polygons give information about the litter sizes.
70
60
50
40
Frequency
30
France
20
DO NOT WRITE IN THIS AREA
10 Italy
0
1 2 3 4 5 6 7 8 9 10
Litter size
(Source: www.academic.oup.com and www.researchgate.net)
Rebecca concludes that the average wild boar litter size in France is bigger than in Italy.
(a) Do the frequency polygons support Rebecca’s conclusion?
Give a reason for your answer.
..................................................................................................................................................................................................................................................
..................................................................................................................................................................................................................................................
(1)
(b) Give another comparison of the distributions of the wild boar litter sizes in France
DO NOT WRITE IN THIS AREA
and in Italy.
..................................................................................................................................................................................................................................................
..................................................................................................................................................................................................................................................
(1)
(c) Discuss how the data collection could reduce the reliability of these conclusions.
..................................................................................................................................................................................................................................................
..................................................................................................................................................................................................................................................
(1)
(Total for Question 1 is 3 marks)
3
Turn over
, 2 The choropleth map gives information about the percentage change in the mileage
driven in Great Britain for each region from 2020 to 2021
DO NOT WRITE IN THIS AREA
Percentage change in mileage driven in 2020 to 2021
Key:
<10
10–12
12–13
Scotland
DO NOT WRITE IN THIS AREA
13–14
≥14
North East
England
Yorkshire and
North West the Humber
England
East
Midlands
West
East of
Midlands
DO NOT WRITE IN THIS AREA
England
Wales
South East
South West
England London
England
(Source: https://roadtraffic.dft.gov.uk)
4