1|Page
Class 11 Maths Chapter 15. Statistics
Statistics is the Science of collection, organization, presentation, analysis and interpretation of
the numerical data.
Useful Terms
1. Limit of the Class
The starting and end values of each class are called Lower and Upper limit.
2. Class Interval
The difference between upper and lower boundary of a class is called class interval or size of
the class.
3. Primary and Secondary Data
The data collected by the investigator himself is known as the primary data, while the data
collected by a person, other than the investigator is known as the secondary data.
4. Variable or Variate
A characteristics that varies in magnitude from observation to observation. e.g., weight, height,
income, age, etc, are variables.
5. Frequency
The number of times an observation occurs in the given data, is called the frequency of the
observation.
6. Discrete Frequency Distribution
A frequency distribution is called a discrete frequency distribution, if data are presented in such
a way that exact measurements of the units are clearly shown.
7. Continuous Frequency Distribution
A frequency distribution in which data are arranged in classes groups which are not exactly
measurable.
Cumulative Frequency Distribution
,2|Page
Suppose the frequencies are grouped frequencies or class frequencies. If however, the
frequency of the first class is added to that of the second and this sum is added to that of the
third and so on, then the frequencies, so obtained are known as cumulative frequencies (cf).
Graphical Representation of Frequency Distributions
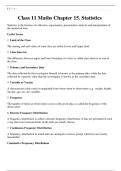
(i) Histogram To draw the histogram of a given continuous frequency distribution, we first
mark off all the class intervals along X-axis on a suitable scale. On each of these class intervals
on the horizontal axis, we erect (vertical) a rectangle whose height is proportional to the
frequency of that particular class, so that the area of the rectangle is proportional to the
frequency of the class.
If however the classes are of unequal width, then the height of the rectangles will be
proportional to the ratio of the frequencies to the width of the classes.
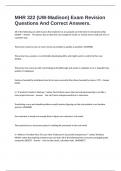
(ii) Bar Diagrams In bar diagrams, only the length of the bars are taken into consideration. To
draw a bar diagram, we first mark equal lengths for the different classes on the axis, i.e., X-
axis.
On each of these lengths on the horizontal axis, we erect (vertical) a rectangle whose heights is
proportional to the frequency of the class.
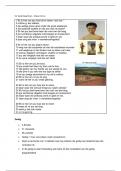
(iii) Pie Diagrams Pie diagrams are used to represent a relative frequency distribution. A pie
diagram consists of a circle divided into as many sectors as there are classes in a frequency
distribution.
The area of each sector is proportional to the relative frequency of the class. Now, we make
angles at the centre proportional to the relative frequencies.
, 3|Page
And in order to get the angles of the desired sectors, we divide 360° in the proportion of the
various relative frequencies. That is,
Central angle = [Frequency x 360° / Total frequency]
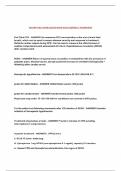
(iv) Frequency Polygon To draw the frequency polygon of an ungrouped frequency
distribution, we plot the points with abscissae as the variate values and the ordinate as the
corresponding frequencies. These plotted points are joined by straight lines to obtain the
frequency polygon.
(v) Cumulative Frequency Curve (Ogive) Ogive is the graphical representation of the
cumulative frequency distribution. There are two methods of constructing an Ogive, viz (i) the
‘less than’ method (ii) the ‘more than’ method.
Class 11 Maths Chapter 15. Statistics
Statistics is the Science of collection, organization, presentation, analysis and interpretation of
the numerical data.
Useful Terms
1. Limit of the Class
The starting and end values of each class are called Lower and Upper limit.
2. Class Interval
The difference between upper and lower boundary of a class is called class interval or size of
the class.
3. Primary and Secondary Data
The data collected by the investigator himself is known as the primary data, while the data
collected by a person, other than the investigator is known as the secondary data.
4. Variable or Variate
A characteristics that varies in magnitude from observation to observation. e.g., weight, height,
income, age, etc, are variables.
5. Frequency
The number of times an observation occurs in the given data, is called the frequency of the
observation.
6. Discrete Frequency Distribution
A frequency distribution is called a discrete frequency distribution, if data are presented in such
a way that exact measurements of the units are clearly shown.
7. Continuous Frequency Distribution
A frequency distribution in which data are arranged in classes groups which are not exactly
measurable.
Cumulative Frequency Distribution
,2|Page
Suppose the frequencies are grouped frequencies or class frequencies. If however, the
frequency of the first class is added to that of the second and this sum is added to that of the
third and so on, then the frequencies, so obtained are known as cumulative frequencies (cf).
Graphical Representation of Frequency Distributions
(i) Histogram To draw the histogram of a given continuous frequency distribution, we first
mark off all the class intervals along X-axis on a suitable scale. On each of these class intervals
on the horizontal axis, we erect (vertical) a rectangle whose height is proportional to the
frequency of that particular class, so that the area of the rectangle is proportional to the
frequency of the class.
If however the classes are of unequal width, then the height of the rectangles will be
proportional to the ratio of the frequencies to the width of the classes.
(ii) Bar Diagrams In bar diagrams, only the length of the bars are taken into consideration. To
draw a bar diagram, we first mark equal lengths for the different classes on the axis, i.e., X-
axis.
On each of these lengths on the horizontal axis, we erect (vertical) a rectangle whose heights is
proportional to the frequency of the class.
(iii) Pie Diagrams Pie diagrams are used to represent a relative frequency distribution. A pie
diagram consists of a circle divided into as many sectors as there are classes in a frequency
distribution.
The area of each sector is proportional to the relative frequency of the class. Now, we make
angles at the centre proportional to the relative frequencies.
, 3|Page
And in order to get the angles of the desired sectors, we divide 360° in the proportion of the
various relative frequencies. That is,
Central angle = [Frequency x 360° / Total frequency]
(iv) Frequency Polygon To draw the frequency polygon of an ungrouped frequency
distribution, we plot the points with abscissae as the variate values and the ordinate as the
corresponding frequencies. These plotted points are joined by straight lines to obtain the
frequency polygon.
(v) Cumulative Frequency Curve (Ogive) Ogive is the graphical representation of the
cumulative frequency distribution. There are two methods of constructing an Ogive, viz (i) the
‘less than’ method (ii) the ‘more than’ method.