Investment and Risk management
Lectures & Tutorials
Learning objectives
- Explain financial risk management and the hedging motives of firms;
- Apply the fundamental models in valuing financial assets (e.g. stocks and
financial derivatives);
- Demonstrate a good knowledge of financial derivatives (e.g. futures,
forwards, swaps and options);
- Identify various financial risks (e.g. interest rate risk, foreign exchange risk)
faced by (international) companies and analyze how these risks can be
managed;
- Analyze empirical research on investments and financial risk management.
Prior knowledge required (!!!)
- Concept of time value of money, compute PV and FV
- Fundamental knowledge of stocks and bonds
- Compute percentage return
- Some mathematical skills, e.g. solve a one-variable equation and a system
of two equations with two variables.
Lecture 1 Introduction to risk and return (02-09)
- Relation between risk and return = higher risk means higher return
- Risk = possibility of loss
Financial Markets
- The markets where financial assets are traded.
- Financial institutions obtain funds from savers and then use these funds for
investments (buy securities).
- Facilitate inter-temporal borrowing and lending (allowing to enlarge choices
between present and future income/consumption).
- Allocate resources and provide pricing information
Financial institutions are intermediary that facilitate the optimal use of
capital
Higher risk = higher return
Investment in Financial Assets / Securities / Instruments
Financial assets = assets that can be traded in the financial market
Four fundamental financial assets:
1. Stocks risk factor, because their prices fluctuate based on company
performance, market conditions, and investor expectations.
2. Bonds the price of the bond is determined by interest rates
a. When investing in bonds, you will receive the interest rates
3. Foreign exchange the exchange rate is a risk factor
4. Commodities the commodity price forms a risk
, Stocks Futures
Bonds Forwards
Foreign Exchange Swaps
Commodities Warrants
Convertibles
….
- Fluctuations in the prices of stocks, bonds, foreign exchange, and are key
determinants of financial risk factors
A derivative is a security whose value depends on the values of underlying
security (i.e. stock, foreign exchange, commodity). Derivatives to reduce
the risks.
Financial institutions facilitate the optimal use of funds. They allocate resources
and provide pricing information.
Return and expected return
Individual asset with risk and return
Portfolio of assets with risk (portfolio = group of assets)
Diversification of portfolio risk:
1. Systematic risk: need to manage this risk beta
2. Unsystematic risk
Portfolio risk = Rho (ρ)
o Varies between (-1, 1)
o 0 means no relation
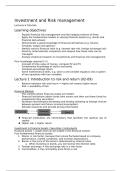
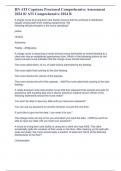
- You invest 100 euro in a stock. Suppose at the end of the period, the value
of your investment will be as follows, and no dividend will be paid out
during the period.
Ending Return (r) Probability of
value state (p)
State 1 (Good 140 = (140-100)/100 = 0.25
economy) 40%
State 2 110 = (110 – 100)/100 = 0.50
10%
State 3 (Bad 80 = (80 – 100) /100 = - 0.25
economy) 20%
- Expended return is important to make an investment decision
- Expected return is also called mean return or mu (μ)
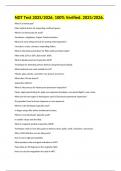
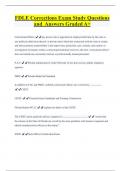
Risk
- Variability in returns is the risk, measured by variance or standard
deviation
Return (r) Squared deviation Probability of
state (p)
State 1 (Good 40% (40% - 10%)2 0.25
economy)
, State 2 10% (10% - 10%)2 0.50
State 3 (Bad -20% (-20% - 10%)2 0.25
economy)
- Formula sheet
will be available!
Standard deviation how valuable your return will be
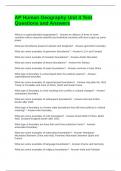
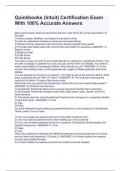
Historical return and risk
- You have observed returns over the past three Return
months. (r)
What is the average return and risk? Month 1 40%
There is no more “expected” return, because it is Month 2 10%
Month 3 -20%
in the past
Portfolio return and Risk equations
- Portfolio = a group of assets
- x stands for the weight, so the sum of all x’s is 100%
- X = weight of assets
- You have to multiply with ρ if the assets interact, only in two boxes!
When the assets interact with itself, the correlation is 1. So you don’t need
to multiply with rho (ρ)
When the assets are not well correlated (so lower ρ), you reduce the risk of
your investments.
Portfolio Risk Example
Example
, - Suppose you invest 60% of your portfolio in Southwest Airlines and the
remainder in Amazon. The expected return on your Southwest investment
is 15.0% and on Amazon is 10.0%.
- The expected return on your portfolio is:
o Expected return (0.60 * 15) (0.40 *10) = 13%
- The standard deviation of returns was 26.6% for Amazon and 27.9% for
Southwest Airlines.
1. Assume a correlation coefficient of 1.0 and calculate the portfolio
variance.
2. Assume a correlation coefficient of 0.26 and calculate the portfolio
variance.
3. Assume a correlation coefficient of –1 and calculate the portfolio
variance
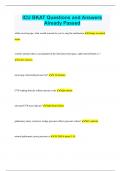
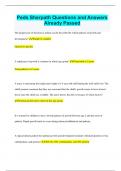
Portfolio of two assets with different correlation coefficient
- You want to maximize the
mean return and minimize the variance (standard deviation)
- Rho (ρ) is the parameter that determines the curve connecting the dots of
the two assets.
o If the correlation (ρ) = 1, a straight line connects the two assets.
σp2 =
- The smaller the ρ, the curve will be more to the left.
Lectures & Tutorials
Learning objectives
- Explain financial risk management and the hedging motives of firms;
- Apply the fundamental models in valuing financial assets (e.g. stocks and
financial derivatives);
- Demonstrate a good knowledge of financial derivatives (e.g. futures,
forwards, swaps and options);
- Identify various financial risks (e.g. interest rate risk, foreign exchange risk)
faced by (international) companies and analyze how these risks can be
managed;
- Analyze empirical research on investments and financial risk management.
Prior knowledge required (!!!)
- Concept of time value of money, compute PV and FV
- Fundamental knowledge of stocks and bonds
- Compute percentage return
- Some mathematical skills, e.g. solve a one-variable equation and a system
of two equations with two variables.
Lecture 1 Introduction to risk and return (02-09)
- Relation between risk and return = higher risk means higher return
- Risk = possibility of loss
Financial Markets
- The markets where financial assets are traded.
- Financial institutions obtain funds from savers and then use these funds for
investments (buy securities).
- Facilitate inter-temporal borrowing and lending (allowing to enlarge choices
between present and future income/consumption).
- Allocate resources and provide pricing information
Financial institutions are intermediary that facilitate the optimal use of
capital
Higher risk = higher return
Investment in Financial Assets / Securities / Instruments
Financial assets = assets that can be traded in the financial market
Four fundamental financial assets:
1. Stocks risk factor, because their prices fluctuate based on company
performance, market conditions, and investor expectations.
2. Bonds the price of the bond is determined by interest rates
a. When investing in bonds, you will receive the interest rates
3. Foreign exchange the exchange rate is a risk factor
4. Commodities the commodity price forms a risk
, Stocks Futures
Bonds Forwards
Foreign Exchange Swaps
Commodities Warrants
Convertibles
….
- Fluctuations in the prices of stocks, bonds, foreign exchange, and are key
determinants of financial risk factors
A derivative is a security whose value depends on the values of underlying
security (i.e. stock, foreign exchange, commodity). Derivatives to reduce
the risks.
Financial institutions facilitate the optimal use of funds. They allocate resources
and provide pricing information.
Return and expected return
Individual asset with risk and return
Portfolio of assets with risk (portfolio = group of assets)
Diversification of portfolio risk:
1. Systematic risk: need to manage this risk beta
2. Unsystematic risk
Portfolio risk = Rho (ρ)
o Varies between (-1, 1)
o 0 means no relation
- You invest 100 euro in a stock. Suppose at the end of the period, the value
of your investment will be as follows, and no dividend will be paid out
during the period.
Ending Return (r) Probability of
value state (p)
State 1 (Good 140 = (140-100)/100 = 0.25
economy) 40%
State 2 110 = (110 – 100)/100 = 0.50
10%
State 3 (Bad 80 = (80 – 100) /100 = - 0.25
economy) 20%
- Expended return is important to make an investment decision
- Expected return is also called mean return or mu (μ)
Risk
- Variability in returns is the risk, measured by variance or standard
deviation
Return (r) Squared deviation Probability of
state (p)
State 1 (Good 40% (40% - 10%)2 0.25
economy)
, State 2 10% (10% - 10%)2 0.50
State 3 (Bad -20% (-20% - 10%)2 0.25
economy)
- Formula sheet
will be available!
Standard deviation how valuable your return will be
Historical return and risk
- You have observed returns over the past three Return
months. (r)
What is the average return and risk? Month 1 40%
There is no more “expected” return, because it is Month 2 10%
Month 3 -20%
in the past
Portfolio return and Risk equations
- Portfolio = a group of assets
- x stands for the weight, so the sum of all x’s is 100%
- X = weight of assets
- You have to multiply with ρ if the assets interact, only in two boxes!
When the assets interact with itself, the correlation is 1. So you don’t need
to multiply with rho (ρ)
When the assets are not well correlated (so lower ρ), you reduce the risk of
your investments.
Portfolio Risk Example
Example
, - Suppose you invest 60% of your portfolio in Southwest Airlines and the
remainder in Amazon. The expected return on your Southwest investment
is 15.0% and on Amazon is 10.0%.
- The expected return on your portfolio is:
o Expected return (0.60 * 15) (0.40 *10) = 13%
- The standard deviation of returns was 26.6% for Amazon and 27.9% for
Southwest Airlines.
1. Assume a correlation coefficient of 1.0 and calculate the portfolio
variance.
2. Assume a correlation coefficient of 0.26 and calculate the portfolio
variance.
3. Assume a correlation coefficient of –1 and calculate the portfolio
variance
Portfolio of two assets with different correlation coefficient
- You want to maximize the
mean return and minimize the variance (standard deviation)
- Rho (ρ) is the parameter that determines the curve connecting the dots of
the two assets.
o If the correlation (ρ) = 1, a straight line connects the two assets.
σp2 =
- The smaller the ρ, the curve will be more to the left.