GLO-BUS DECISION
SUMMARY &
REPORTS YEAR 11/
DECISION SUMMARY
YEAR 13/ DECISION
SUMMARY 14/
DECISION SUMMARY
15 LATEST UPDATE
2025-2026
,18:35 01/04/2025 GLO-BUS Decisions & Reports
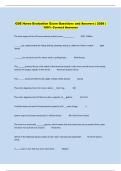
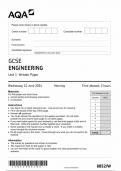
Industry 24 Competitive Intelligence Reports — Comparative Competitive Efforts Year 11
Co. D
North America Competitive Efforts by Company Ind. vs Ind.
A B C D Avg. Avg.
AC CAMERA SEGMENT
Price (average wholesale $ per unit) 534 620 630 580 591 -1.9 %
P/Q Rating (1 to 10 stars) 8.3★ 8.5★ 8.5★ 8.9★ 8.6★ +3.5 %
Brand Reputation (prior-year image) 91 74 84 80 82 -2.4 %
Number of Models 3 3 4 3 3.3 -9.1 %
Retail Multi-Store Chains 70 70 75 73 72 +1.4 %
Outlets Online Retailers 184 180 181 176 180 -2.2 %
Local Retailers 7,030 7,030 7,713 7,450 7,306 +2.0 %
Retailer Support ($ per unit) 12.78 13.09 10.35 14.03 12.56 +11.7 %
Advertising Budget ($000s) 4,400 5,500 5,500 4,800 5,050 -5.0 %
Website Displays ($000s) 3,625 4,000 4,200 3,825 3,913 -2.2 %
Sales PromotionsWeeks 16 16 16 16 16.0 0%
Discount 16.0 % 22.0 % 20.0 % 21.0 % 19.8 % +6.1 %
Warranty Period (days) 360 360 360 180 315 -42.9 %
Demand for ACC Units (000s) 317.0 267.3 289.8 277.9 288.0 -3.5 %
Gained/Lost (due to stockouts) 0 0 0 0 0
AC Camera Units Sold (000s) 317.0 267.3 289.8 277.9 288.0 -3.5 %
Market Share 27.5 % 23.2 % 25.2 % 24.1 % 25.0 % -0.9 pts.
Special AC Camera Contracts
Discount Offer (% off standard price) 40.0 % 40.0 % 40.0 % 40.0 % Avg. Discount = 40.0 %
Value Index 61 53 55 58 Avg. Value Index = 57
Special Contract Units Sold (000s) 31.7 0.0 0.0 0.0 Total Units = 31.7 k
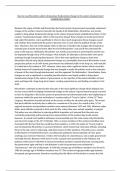
UAV DRONE SEGMENT
Price (average direct-sale $ per unit) 3,050 3,100 3,600 3,400 3,288 +3.4 %
Discount to Online Retailers 14 % 15 % 14 % 15 % 14.5 % +3.4 %
P/Q Rating (1 to 10 stars) 8.5★ 8.5★ 8.7★ 9.3★ 8.8★ +5.7 %
Brand Reputation (prior-year image) 91 74 84 80 82 -2.4 %
Number of Models 3 3 3 2 2.8 -28.6 %
Online Retailers 54 56 42 50 51 -2.0 %
Website Displays ($000s) 5,000 5,000 4,800 3,000 4,450 -32.6 %
Search Engine Advertising ($000s) 7,000 6,000 6,930 6,300 6,558 -3.9 %
Retailer Recruitment ($ per unit) 111.94 102.46 68.97 94.79 94.54 +0.3 %
Warranty Period (days) 360 360 360 360 360 0%
Drone Unit Direct (company website) 62.6 56.8 53.6 49.3 55.6 -11.3 %
Demand 3rd-Party Retailers 26.8 24.4 17.4 21.1 22.4 -5.8 %
(000s) Total Demand 89.4 81.2 71.0 70.4 78.0 -9.7 %
Gained/Lost (due to stockouts) 0 0 0 0 0
UAV Drone Units Sold (000s) 89.4 81.2 71.0 70.4 78.0 -9.7 %
Market Share 28.6 % 26.0 % 22.8 % 22.6 % 25.0 % -2.4 pts.
, 18:35 01/04/2025 GLO-BUS Decisions & Reports
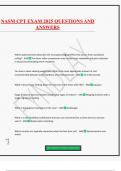
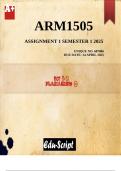
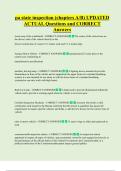
AC CAMERA SEGMENT — NORTH AMERICA UAV DRONE SEGMENT — NORTH AMERICA
High End High End
DC
C B
D
B A
A
Price and P/Q Rating
Price and P/Q Rating
A A
B B
C C
D D
Low End Low End
Low High Low High
Sales Promotions / Advertising Search Engine Advertising / Retailer Discount
Competitive Intelligence Report Copyright © GLO-BUS Software, Inc. Page 1
SUMMARY &
REPORTS YEAR 11/
DECISION SUMMARY
YEAR 13/ DECISION
SUMMARY 14/
DECISION SUMMARY
15 LATEST UPDATE
2025-2026
,18:35 01/04/2025 GLO-BUS Decisions & Reports
Industry 24 Competitive Intelligence Reports — Comparative Competitive Efforts Year 11
Co. D
North America Competitive Efforts by Company Ind. vs Ind.
A B C D Avg. Avg.
AC CAMERA SEGMENT
Price (average wholesale $ per unit) 534 620 630 580 591 -1.9 %
P/Q Rating (1 to 10 stars) 8.3★ 8.5★ 8.5★ 8.9★ 8.6★ +3.5 %
Brand Reputation (prior-year image) 91 74 84 80 82 -2.4 %
Number of Models 3 3 4 3 3.3 -9.1 %
Retail Multi-Store Chains 70 70 75 73 72 +1.4 %
Outlets Online Retailers 184 180 181 176 180 -2.2 %
Local Retailers 7,030 7,030 7,713 7,450 7,306 +2.0 %
Retailer Support ($ per unit) 12.78 13.09 10.35 14.03 12.56 +11.7 %
Advertising Budget ($000s) 4,400 5,500 5,500 4,800 5,050 -5.0 %
Website Displays ($000s) 3,625 4,000 4,200 3,825 3,913 -2.2 %
Sales PromotionsWeeks 16 16 16 16 16.0 0%
Discount 16.0 % 22.0 % 20.0 % 21.0 % 19.8 % +6.1 %
Warranty Period (days) 360 360 360 180 315 -42.9 %
Demand for ACC Units (000s) 317.0 267.3 289.8 277.9 288.0 -3.5 %
Gained/Lost (due to stockouts) 0 0 0 0 0
AC Camera Units Sold (000s) 317.0 267.3 289.8 277.9 288.0 -3.5 %
Market Share 27.5 % 23.2 % 25.2 % 24.1 % 25.0 % -0.9 pts.
Special AC Camera Contracts
Discount Offer (% off standard price) 40.0 % 40.0 % 40.0 % 40.0 % Avg. Discount = 40.0 %
Value Index 61 53 55 58 Avg. Value Index = 57
Special Contract Units Sold (000s) 31.7 0.0 0.0 0.0 Total Units = 31.7 k
UAV DRONE SEGMENT
Price (average direct-sale $ per unit) 3,050 3,100 3,600 3,400 3,288 +3.4 %
Discount to Online Retailers 14 % 15 % 14 % 15 % 14.5 % +3.4 %
P/Q Rating (1 to 10 stars) 8.5★ 8.5★ 8.7★ 9.3★ 8.8★ +5.7 %
Brand Reputation (prior-year image) 91 74 84 80 82 -2.4 %
Number of Models 3 3 3 2 2.8 -28.6 %
Online Retailers 54 56 42 50 51 -2.0 %
Website Displays ($000s) 5,000 5,000 4,800 3,000 4,450 -32.6 %
Search Engine Advertising ($000s) 7,000 6,000 6,930 6,300 6,558 -3.9 %
Retailer Recruitment ($ per unit) 111.94 102.46 68.97 94.79 94.54 +0.3 %
Warranty Period (days) 360 360 360 360 360 0%
Drone Unit Direct (company website) 62.6 56.8 53.6 49.3 55.6 -11.3 %
Demand 3rd-Party Retailers 26.8 24.4 17.4 21.1 22.4 -5.8 %
(000s) Total Demand 89.4 81.2 71.0 70.4 78.0 -9.7 %
Gained/Lost (due to stockouts) 0 0 0 0 0
UAV Drone Units Sold (000s) 89.4 81.2 71.0 70.4 78.0 -9.7 %
Market Share 28.6 % 26.0 % 22.8 % 22.6 % 25.0 % -2.4 pts.
, 18:35 01/04/2025 GLO-BUS Decisions & Reports
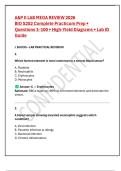
AC CAMERA SEGMENT — NORTH AMERICA UAV DRONE SEGMENT — NORTH AMERICA
High End High End
DC
C B
D
B A
A
Price and P/Q Rating
Price and P/Q Rating
A A
B B
C C
D D
Low End Low End
Low High Low High
Sales Promotions / Advertising Search Engine Advertising / Retailer Discount
Competitive Intelligence Report Copyright © GLO-BUS Software, Inc. Page 1