Macroeconomics samenvatting
Week 1
The difference between macroeconomics and microeconomics is that
macroeconomics needs to go beyond individual actions and think of the aggregate
implications of those actions. Keynes general theory was the first book to divide a
distrinct macroeconomic theory.
Macroeconomics can be simply defined as a branch of economics dealing with the
performance, structure, behavior, and decision-making of an economy as a whole.
You must think in a aggregate economic variables.
The most common measure of aggregate economic activity is Gross Domestic
Product. Defined as the value of all final goods and services produced by a given
economy in a given period. GDP, however, only reflects material well-being and
ignores other factors that contribute that. GDP should be understood as capturing the
vibrancy of economic activity and not necessarily the welfare of individuals.
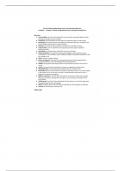
GDP can be measured in 3 different ways:
- Summing up the value of the final goods and services in the economy in a
given period
- By summing up all spending on domestic goods and services in the economy
in a given period
- By summing up all incomes paid in the economy in a given period
The values and prices may change over the time.Herefore we make a difference in
Nominal GDP and Real GDP.
Nominal GDP: is the value of all the goods produced in the economy measured using
changing or current prices.
Real GDP; the value of all the goods produced in the economy measured using fixed
or constant prices.
GDP per capita is the GDP/ by the population. This gives a sense of how much
output is available for each individual. The growth rate captures how these standards
change over time. Positive> growth indicates periods of economic expansion.
Negative> growth indicates periods of economics recession.
First macroeconomic model: What determines GDP in a given year. The national
income accounting identity:
,For consumptions goes the goods and services purchased by consumers. This
depends on Disposable income, remains after Tax paid.
Where Yd= Y-T en c reflects the marginal propensity to consume.
Investment spending, reflects purchases of capital goods. The amount of investment
undertaken may depend on current economic condition. When firms have a given
investment target:
Government spending, refers to the purchases of goods and
services by the government. It will be financed by tax revenue. G and T will be
exogenous variable.
NX= EX-IM, but we will use a closed economy.
The aggregate demand will be then Z= C+I+G
Equilibrium condition, when supply wants to produce demand. Y=Z
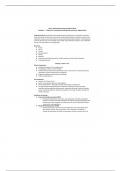
You can solve it Mathematical
Graphical:
Plot the demand and supply as a function of income. Where the line cross is the
equilibrium.
If the government increases spending. The demand line will shift equal a billion. This
lead to an equal increase in production. What leads to a increase in 1 billion for
income as well. In the second round demand will increase with c x 1 billion. This
leads to the same for income and production. For the third round goes c^2 x billion.
So this equals 1/1-c x billion.
This implies the multiplier effect, by an increase of government spending the output
will increase more.
Week 2
Advantage of the model is delivering a clear and strong result. Changes in aggregate
spending have large effects on output. Disadvantage: aggregate output is not
affected by developments in markets other that the goods market. We have to
connect it with the rest of the economy.
, For Investment we can conclude:
Here is I the interest rate
A higher value for Y increases sales and forces firms to invest in order to increase
production. A higher value for I makes it less attractive for firms to borrow and invest.
The equation will then be:
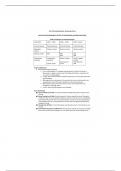
So Y depends on I. Suppose that the interest rises from I to I’. This should reduce
demand and lead to a fall in output.
When I goes up than the demand will decrease
and asswell output. This is referred to the IS-
curve, what gives the negative relationship
between investment and income. D
It is based on i=S , but based of the equity
Y=C+I+G
Y depends on I
then we have
two
endogenous variables. We need a second
equation to determine i.
We do this from the money market. This can be
analyzed like any market on supply and demand.
The economy money-supply is fixed and
controlled by the central bank. The demand is based on the preference of
households and firms to hold their wealth in money versus other assets. Interaction
between determines the quantity of money circulating
The price of money> the interest rate
If we consider an economy without commercial banks, households keep wealth in:
- Cash
- Government Bonds.
Here quantity of money demanded depends on:
- Number of transactions: proportional to nominal income, higher more demand
Week 1
The difference between macroeconomics and microeconomics is that
macroeconomics needs to go beyond individual actions and think of the aggregate
implications of those actions. Keynes general theory was the first book to divide a
distrinct macroeconomic theory.
Macroeconomics can be simply defined as a branch of economics dealing with the
performance, structure, behavior, and decision-making of an economy as a whole.
You must think in a aggregate economic variables.
The most common measure of aggregate economic activity is Gross Domestic
Product. Defined as the value of all final goods and services produced by a given
economy in a given period. GDP, however, only reflects material well-being and
ignores other factors that contribute that. GDP should be understood as capturing the
vibrancy of economic activity and not necessarily the welfare of individuals.
GDP can be measured in 3 different ways:
- Summing up the value of the final goods and services in the economy in a
given period
- By summing up all spending on domestic goods and services in the economy
in a given period
- By summing up all incomes paid in the economy in a given period
The values and prices may change over the time.Herefore we make a difference in
Nominal GDP and Real GDP.
Nominal GDP: is the value of all the goods produced in the economy measured using
changing or current prices.
Real GDP; the value of all the goods produced in the economy measured using fixed
or constant prices.
GDP per capita is the GDP/ by the population. This gives a sense of how much
output is available for each individual. The growth rate captures how these standards
change over time. Positive> growth indicates periods of economic expansion.
Negative> growth indicates periods of economics recession.
First macroeconomic model: What determines GDP in a given year. The national
income accounting identity:
,For consumptions goes the goods and services purchased by consumers. This
depends on Disposable income, remains after Tax paid.
Where Yd= Y-T en c reflects the marginal propensity to consume.
Investment spending, reflects purchases of capital goods. The amount of investment
undertaken may depend on current economic condition. When firms have a given
investment target:
Government spending, refers to the purchases of goods and
services by the government. It will be financed by tax revenue. G and T will be
exogenous variable.
NX= EX-IM, but we will use a closed economy.
The aggregate demand will be then Z= C+I+G
Equilibrium condition, when supply wants to produce demand. Y=Z
You can solve it Mathematical
Graphical:
Plot the demand and supply as a function of income. Where the line cross is the
equilibrium.
If the government increases spending. The demand line will shift equal a billion. This
lead to an equal increase in production. What leads to a increase in 1 billion for
income as well. In the second round demand will increase with c x 1 billion. This
leads to the same for income and production. For the third round goes c^2 x billion.
So this equals 1/1-c x billion.
This implies the multiplier effect, by an increase of government spending the output
will increase more.
Week 2
Advantage of the model is delivering a clear and strong result. Changes in aggregate
spending have large effects on output. Disadvantage: aggregate output is not
affected by developments in markets other that the goods market. We have to
connect it with the rest of the economy.
, For Investment we can conclude:
Here is I the interest rate
A higher value for Y increases sales and forces firms to invest in order to increase
production. A higher value for I makes it less attractive for firms to borrow and invest.
The equation will then be:
So Y depends on I. Suppose that the interest rises from I to I’. This should reduce
demand and lead to a fall in output.
When I goes up than the demand will decrease
and asswell output. This is referred to the IS-
curve, what gives the negative relationship
between investment and income. D
It is based on i=S , but based of the equity
Y=C+I+G
Y depends on I
then we have
two
endogenous variables. We need a second
equation to determine i.
We do this from the money market. This can be
analyzed like any market on supply and demand.
The economy money-supply is fixed and
controlled by the central bank. The demand is based on the preference of
households and firms to hold their wealth in money versus other assets. Interaction
between determines the quantity of money circulating
The price of money> the interest rate
If we consider an economy without commercial banks, households keep wealth in:
- Cash
- Government Bonds.
Here quantity of money demanded depends on:
- Number of transactions: proportional to nominal income, higher more demand