Week 6 Test - Results
Attempt 1 of 2
Written Jul 9, 2025 12:31 AM - Jul 9, 2025 1:05 AM
Attempt Score - 95 %
Overall Grade (Highest Attempt) - 95 %
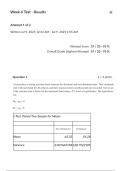
Question 1 point
A researcher is testing reaction times between the dominant and non-dominant hand. They randomly
start with each hand for 20 subjects and their reaction times in milliseconds are recorded. Test to see
if the reaction time is faster for the dominant hand using a 5% level of significance. The hypotheses
are:
H0 : μD = 0
H1 : μD > 0
t-Test: Paired Two Sample for Means
Non-Dominant Dominant
Mean 63.33 56.28
Variance 218.9643158 128.7522105
,Observations 20 20
Pearson Correlation 0.9067
Hypothesized Mean Difference 0
df 19
t Stat 4.7951
P(T<=t) one-tail 0.0001
t Critical one-tail 1.7291
P(T<=t) two-tail 0.0001
t Critical two-tail 2.0930
What is the correct test statistic?
0.9067
1.7291
0.0001
2.0930
4.7951
Hide question 1 feedback
, Feedback
The Test stat is 4.7951. This is given to you in the output. No calculations are
needed.
The Test stat is 4.7951. This is given to you in the output. No calculations are
needed.
Question 2 point
An adviser is testing out a new online learning module for a placement test. They wish to test the
claim that on average the new online learning module increased placement scores at a significance
level of α = 0.05. For the context of this problem, μD=μnew–μold where the first data set represents
the new test scores and the second data set represents old test scores. Assume the population is
normally distributed.
H0: μD = 0
H1: μD < 0
You obtain the following paired sample of 19 students that took the placement test before and after
the learning module:
Find the p-value. Round answer to 4 decimal places.
New
Old LM
LM p-value =
___0.1987___
57.1 55.8
58.3 51.7
83.6 76.6
50.5 47.5
51.5 48.6
Attempt 1 of 2
Written Jul 9, 2025 12:31 AM - Jul 9, 2025 1:05 AM
Attempt Score - 95 %
Overall Grade (Highest Attempt) - 95 %
Question 1 point
A researcher is testing reaction times between the dominant and non-dominant hand. They randomly
start with each hand for 20 subjects and their reaction times in milliseconds are recorded. Test to see
if the reaction time is faster for the dominant hand using a 5% level of significance. The hypotheses
are:
H0 : μD = 0
H1 : μD > 0
t-Test: Paired Two Sample for Means
Non-Dominant Dominant
Mean 63.33 56.28
Variance 218.9643158 128.7522105
,Observations 20 20
Pearson Correlation 0.9067
Hypothesized Mean Difference 0
df 19
t Stat 4.7951
P(T<=t) one-tail 0.0001
t Critical one-tail 1.7291
P(T<=t) two-tail 0.0001
t Critical two-tail 2.0930
What is the correct test statistic?
0.9067
1.7291
0.0001
2.0930
4.7951
Hide question 1 feedback
, Feedback
The Test stat is 4.7951. This is given to you in the output. No calculations are
needed.
The Test stat is 4.7951. This is given to you in the output. No calculations are
needed.
Question 2 point
An adviser is testing out a new online learning module for a placement test. They wish to test the
claim that on average the new online learning module increased placement scores at a significance
level of α = 0.05. For the context of this problem, μD=μnew–μold where the first data set represents
the new test scores and the second data set represents old test scores. Assume the population is
normally distributed.
H0: μD = 0
H1: μD < 0
You obtain the following paired sample of 19 students that took the placement test before and after
the learning module:
Find the p-value. Round answer to 4 decimal places.
New
Old LM
LM p-value =
___0.1987___
57.1 55.8
58.3 51.7
83.6 76.6
50.5 47.5
51.5 48.6