Causal Analysis Techniques
Table of Content
LECTURE 1 ________________________________________________________________________ 2
LECTURE 2 ________________________________________________________________________ 7
LECTURE 3 _______________________________________________________________________ 13
LECTURE 4 _______________________________________________________________________ 20
LECTURE 5 _______________________________________________________________________ 26
LECTURE 6 _______________________________________________________________________ 39
LECTURE 7 _______________________________________________________________________ 43
LECTURE 8 _______________________________________________________________________ 55
LECTURE 9 _______________________________________________________________________ 58
LECTURE 10 ______________________________________________________________________ 63
LECTURE 11 ______________________________________________________________________ 67
LECTURE 12 ______________________________________________________________________ 78
LECTURE 13 ______________________________________________________________________ 86
LECTURE 14 ______________________________________________________________________ 94
,Lecture 1
ANOVA (Analysis Of Variance)
Use ANOVA with a hypothesis like this:
A person’s degree of organizational commitment (Y) depends on the team in which the
person works (X).
Key idea of ANOVA: when there are two or more groups, can we make a statement about
possible (significant) differences between the mean scores of the groups?
- What could we do if there were only two groups? T-test.
- ANOVA is essentially the same as a t-test, but just with more groups.
Fundamental principle of ANOVA:
ANOVA analyses the ratio of the two components of total variance in data; between-group
variance and within group variance.
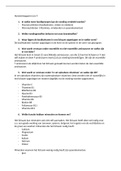
Logic of ANOVA
In above example, the averages are the same but the variances are different because of the
different scores. So there is less variability in the scores within teams.
Between-group variance: is about the total variation between each group mean and the
overall mean. (it’s about the means).
2
,Within-group variance: is about the total variation in the individual values in each group and
their group mean (everything here cannot be systematic, due to the independent variable
because it’s the same team). (it’s about the variation).
ANOVA analyses ratio in which;
1. between-group variance measures systematic differences between groups and all
other variables that influence Y, either systematically or randomly (‘residual variance’
or ‘error’)
2. Within-group variance measures influence of all other variables that influence Y
either systematically or randomly (‘residual variance’ or ‘error’)
Important to realize
1. Any differences within a group cannot be due to differences between the groups
because everyone in a particular group has the same group score; so, within-group
differences must be due to systematic unmeasured factors (e.g. individual
differences) or random measurement error.
2. Any observed differences between groups are probably not only pure between-group
differences, but also differences due to systematic unmeasured factors or random
measurement error.
Compare between-group variability (= systematic group effect + error) to within-group
variability (=error) to learn about the size of the systematic group effect.
Example:
Within the group, not all the flowers have the same size, there is some fluctuation. Within
the group there cannot be a systematic difference due to the independent variable, in this
case the soil. There is a systematic difference between the groups because the rich soil has
better/bigger flowers. But there might be an explanation of the difference, due to a variable
we didn’t consider = random error, like the sun hours that the flowers got (because of
accidental placement) or the amount of water that was accidently different between the
groups and that might be why one group has better flowers.
ANOVA doesn’t say anything about the causal relationship due to more variables that can
have an influence on the differences between the groups, which you cannot control (the
variables).
3
, Statistical null hypothesis of One-Way Between-Subjects ANOVA:
Mean scores of k populations corresponding to the groups in the study are all equal to each
other:
We reject H0: when at least one mean is significantly different from the other means.
Intermezzo:
Why prefer One-Way Between-Subjects ANOVA instead of separate t-tests for means?
With a t-test you can look at the systematic difference between two groups and with ANOVA
with more groups.
In this example with 3 teams, we could also conduct 3 separate t-tests for means:
Problem of this approach is that the larger the number of tests that is applied to a dataset,
the larger the chance of rejecting the null hypothesis while it is correct (Type I error). For
example if the significance level is .05, if you do the test three times, there will be 3 x .05 so
more risk. So the risk of making the wrong decision is inflated.
Why? It follows from logic of hypothesis testing: we reject the null hypothesis if a result is
exceptional, but the more tests we conduct, the easier it is to find an exceptional result.
One will easier make the mistake of concluding that there is an effect, while there is not. This
is called: Inflated risk of Type I error.
Formula for calculation of chance of one or more Type I errors in a series of C tests with
significance level a:
Therefore with three separate tests with a = .05 the chance of unjustified rejection of the null
hypothesis is:
Solution: use One-Way ANOVA -> one single omnibus test for the null hypothesis that the
means of K populations are equal, with chance of Type I error = .05
Calculation: F-statistic
If we want to test the statistical null hypothesis: . With an ANOVA, the F-
distribution is used.
In order to determine if a specific sample result is exceptional (‘significant’) under the
assumption that the statistical null hypothesis is correct, the test-statistic F has to be
calculated.
Calculations: Deviations
Strategy: Partition of scores into components
- Component of score is associated with ‘group’
- Component of score that is not associated with ‘group’
How can you do this? Calculate deviation scores.
4
Table of Content
LECTURE 1 ________________________________________________________________________ 2
LECTURE 2 ________________________________________________________________________ 7
LECTURE 3 _______________________________________________________________________ 13
LECTURE 4 _______________________________________________________________________ 20
LECTURE 5 _______________________________________________________________________ 26
LECTURE 6 _______________________________________________________________________ 39
LECTURE 7 _______________________________________________________________________ 43
LECTURE 8 _______________________________________________________________________ 55
LECTURE 9 _______________________________________________________________________ 58
LECTURE 10 ______________________________________________________________________ 63
LECTURE 11 ______________________________________________________________________ 67
LECTURE 12 ______________________________________________________________________ 78
LECTURE 13 ______________________________________________________________________ 86
LECTURE 14 ______________________________________________________________________ 94
,Lecture 1
ANOVA (Analysis Of Variance)
Use ANOVA with a hypothesis like this:
A person’s degree of organizational commitment (Y) depends on the team in which the
person works (X).
Key idea of ANOVA: when there are two or more groups, can we make a statement about
possible (significant) differences between the mean scores of the groups?
- What could we do if there were only two groups? T-test.
- ANOVA is essentially the same as a t-test, but just with more groups.
Fundamental principle of ANOVA:
ANOVA analyses the ratio of the two components of total variance in data; between-group
variance and within group variance.
Logic of ANOVA
In above example, the averages are the same but the variances are different because of the
different scores. So there is less variability in the scores within teams.
Between-group variance: is about the total variation between each group mean and the
overall mean. (it’s about the means).
2
,Within-group variance: is about the total variation in the individual values in each group and
their group mean (everything here cannot be systematic, due to the independent variable
because it’s the same team). (it’s about the variation).
ANOVA analyses ratio in which;
1. between-group variance measures systematic differences between groups and all
other variables that influence Y, either systematically or randomly (‘residual variance’
or ‘error’)
2. Within-group variance measures influence of all other variables that influence Y
either systematically or randomly (‘residual variance’ or ‘error’)
Important to realize
1. Any differences within a group cannot be due to differences between the groups
because everyone in a particular group has the same group score; so, within-group
differences must be due to systematic unmeasured factors (e.g. individual
differences) or random measurement error.
2. Any observed differences between groups are probably not only pure between-group
differences, but also differences due to systematic unmeasured factors or random
measurement error.
Compare between-group variability (= systematic group effect + error) to within-group
variability (=error) to learn about the size of the systematic group effect.
Example:
Within the group, not all the flowers have the same size, there is some fluctuation. Within
the group there cannot be a systematic difference due to the independent variable, in this
case the soil. There is a systematic difference between the groups because the rich soil has
better/bigger flowers. But there might be an explanation of the difference, due to a variable
we didn’t consider = random error, like the sun hours that the flowers got (because of
accidental placement) or the amount of water that was accidently different between the
groups and that might be why one group has better flowers.
ANOVA doesn’t say anything about the causal relationship due to more variables that can
have an influence on the differences between the groups, which you cannot control (the
variables).
3
, Statistical null hypothesis of One-Way Between-Subjects ANOVA:
Mean scores of k populations corresponding to the groups in the study are all equal to each
other:
We reject H0: when at least one mean is significantly different from the other means.
Intermezzo:
Why prefer One-Way Between-Subjects ANOVA instead of separate t-tests for means?
With a t-test you can look at the systematic difference between two groups and with ANOVA
with more groups.
In this example with 3 teams, we could also conduct 3 separate t-tests for means:
Problem of this approach is that the larger the number of tests that is applied to a dataset,
the larger the chance of rejecting the null hypothesis while it is correct (Type I error). For
example if the significance level is .05, if you do the test three times, there will be 3 x .05 so
more risk. So the risk of making the wrong decision is inflated.
Why? It follows from logic of hypothesis testing: we reject the null hypothesis if a result is
exceptional, but the more tests we conduct, the easier it is to find an exceptional result.
One will easier make the mistake of concluding that there is an effect, while there is not. This
is called: Inflated risk of Type I error.
Formula for calculation of chance of one or more Type I errors in a series of C tests with
significance level a:
Therefore with three separate tests with a = .05 the chance of unjustified rejection of the null
hypothesis is:
Solution: use One-Way ANOVA -> one single omnibus test for the null hypothesis that the
means of K populations are equal, with chance of Type I error = .05
Calculation: F-statistic
If we want to test the statistical null hypothesis: . With an ANOVA, the F-
distribution is used.
In order to determine if a specific sample result is exceptional (‘significant’) under the
assumption that the statistical null hypothesis is correct, the test-statistic F has to be
calculated.
Calculations: Deviations
Strategy: Partition of scores into components
- Component of score is associated with ‘group’
- Component of score that is not associated with ‘group’
How can you do this? Calculate deviation scores.
4