Summary SOC 200 -
v v v
CaseStudyReport1:
v v v v
THREEJAYS
v v
CORPORATION;
v
Completesolution.
v
, Stuvia.com - The Marketplace to Buy and Sell your Study Material
v v v v v v v v v v
Case Study 1 – Three Jays Corporation
v v v v v v 831512392
Case Study Report 1: THREE JAYS CORPORATION
v v v v v v
1. Using the data in case Exhibit 4 and the 2012 annual demand, calculate the EOQ and ROP
v v v v v v v v v v v v v v v v
v quantities for the five SKUs scheduled to be produced in the last week of June. How do these amounts
v v v v v v v v v v v v v v v v v v
v compare with those calculated in 2011? Compare the increases in EOQs with the increases in annual
v v v v v v v v v v v v v v v
v demand. (2.5 points) v v
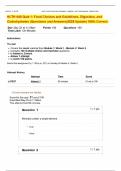
The 2012 Annual Demand is given as
v v v v v v
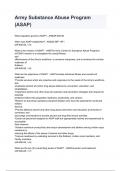
Exhibit 5: Monthly Sales Data
v v v v
Fe Year
Label Type
Jan b Mar Apr May June July Aug Sept Oct Nov Dec Tota
v
3Js Strawberry Jam v
l
2012 345 301 325 299 344 296 329 334 349 325 289 333 3,869
2013 566 671 384 631 616 2,868
Marran
Raspberry Jelly v
Markets
v
2012 229 270 236 279 273 255 236 232 235 276 244 241 3,006
2013 744 737 425 379 571 2,856
Kerry's Marts v Peach Jam v
2012 156 176 174 144 160 178 155 159 178 166 176 148 1,970
2013 167 146 78 84 117 592
Dom's Food v
Blueberry Jam v
Stores
2012 92 109 98 99 102 111 103 99 94 104 107 93 1,211
2013 100 99 80 139 108 526
AAA Grocers
v Apple/Mint Jelly
2012 66 77 79 69 65 66 68 67 62 74 71 68 832
2013 73 63 110 146 88 480
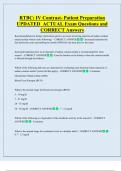
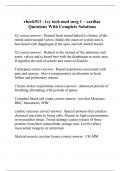
The EOQ and ROP quantities for the five SKU’s based on 2012 annual demand is given as
v v v v v v v v v v v v v v v v
Total Annual Carryin Unit EOQ ROP
Set up
v v Deman
v g Cost
v v v Cost(C) v (cases) (cases)
cost (S) d (D) (i) %
v v v
Strawberry Jam v 63.7 3869 9% 28.34 440 223
Raspberry Jam v 63.7 3006 9% 30.52 373 173
Page 1 of 12 v v v
Downloaded by: proved | v v v v
Distribution of this document is illegal v v v v v
v v v
CaseStudyReport1:
v v v v
THREEJAYS
v v
CORPORATION;
v
Completesolution.
v
, Stuvia.com - The Marketplace to Buy and Sell your Study Material
v v v v v v v v v v
Case Study 1 – Three Jays Corporation
v v v v v v 831512392
Case Study Report 1: THREE JAYS CORPORATION
v v v v v v
1. Using the data in case Exhibit 4 and the 2012 annual demand, calculate the EOQ and ROP
v v v v v v v v v v v v v v v v
v quantities for the five SKUs scheduled to be produced in the last week of June. How do these amounts
v v v v v v v v v v v v v v v v v v
v compare with those calculated in 2011? Compare the increases in EOQs with the increases in annual
v v v v v v v v v v v v v v v
v demand. (2.5 points) v v
The 2012 Annual Demand is given as
v v v v v v
Exhibit 5: Monthly Sales Data
v v v v
Fe Year
Label Type
Jan b Mar Apr May June July Aug Sept Oct Nov Dec Tota
v
3Js Strawberry Jam v
l
2012 345 301 325 299 344 296 329 334 349 325 289 333 3,869
2013 566 671 384 631 616 2,868
Marran
Raspberry Jelly v
Markets
v
2012 229 270 236 279 273 255 236 232 235 276 244 241 3,006
2013 744 737 425 379 571 2,856
Kerry's Marts v Peach Jam v
2012 156 176 174 144 160 178 155 159 178 166 176 148 1,970
2013 167 146 78 84 117 592
Dom's Food v
Blueberry Jam v
Stores
2012 92 109 98 99 102 111 103 99 94 104 107 93 1,211
2013 100 99 80 139 108 526
AAA Grocers
v Apple/Mint Jelly
2012 66 77 79 69 65 66 68 67 62 74 71 68 832
2013 73 63 110 146 88 480
The EOQ and ROP quantities for the five SKU’s based on 2012 annual demand is given as
v v v v v v v v v v v v v v v v
Total Annual Carryin Unit EOQ ROP
Set up
v v Deman
v g Cost
v v v Cost(C) v (cases) (cases)
cost (S) d (D) (i) %
v v v
Strawberry Jam v 63.7 3869 9% 28.34 440 223
Raspberry Jam v 63.7 3006 9% 30.52 373 173
Page 1 of 12 v v v
Downloaded by: proved | v v v v
Distribution of this document is illegal v v v v v