Unit 10 Big Data analytics Assignment B
Introduction
I have started an internship at an educational charity. During this internship I will work with
big data to increase the charity’s programs. The charity wants to see what is different areas
GCSE result in England of boys and girls. I will use different mathematics to study the data
like making charts and tables, finding averages and using probability. These results I will be
written in a report, and it will be for whoever understand math so the charity can have a
bigger impact on education.
Pie Chart
Pie Chart is a circular graph which has been broken into slice to represent different data
based out of 100%, this is used for to visualise the data, which data have more percentage
than other one. Pie charts get to most used in business, bank, airport and other areas. For
example, business might use pie chart to show their market share, sales distribution or
different resource allocation and airports may use this pie chart to track the passenger
distribution of the airless. This helps them to understand the data quick way of different
types of data.
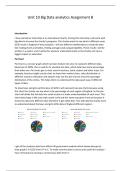
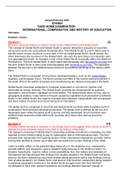
To show boys and girls performance of GCSE I will represent two pie charts because using
this chart the charity can see what is the percentage of each region of England. So this pie
chart will divide the full data into small sections to make understandable of each ones. This
chart data shape is like a pie with round circle and this name was given from pie because it
shows the data into different slice therefore it get called that. This will help the charity more
to understand about the boys and girls GCSE data of England different regions.
I get all the students data from official UK government website which shows who get at
least grade 5 in GCSE from A* to C. To make sure the data is correct and useful for analysis I
have removed any missing or unnecessary data from it.
, The GCSE results for boys in England is get analyse by looking at different statistics of
important numbers from each region to find out which region have did well. So if I look at
the data I can see that Northeast has the highest percentage because the girls they have
achieve 5+ A-C grade which is 58.7% but if we look at east midlands they have been the
lowest with 68.5%. Overall if we look at the mean percentage of the girls, they have been
achieve across all the regions is 71.9% and if we look at standard deviation is 2.6%.
If we look at the percentage of girls including Mathematics and English for Outer London
they have achieve 56.9% for 5+ A-C grades but on the other hand East Midlands got the
lowest with 48.7%. And mean for this overall is 51.9% and with standard deviation is 3.3%.
The percentage of girls being entered for GCSE it’s in inner London with highest percentage
number 97.0% and north west got the lowest which is 96.4%. The mean of girls being
entered is 96.7% this is for GCSE and with standard deviation is 0.2%.
If we do an analysis of GCSE results based on the region and different gender there is an
inconsistency with the data. If we look at London, they have done well with 75.5% which
they have achieve in 5+ A-C grade also with Maths and English 64.1%. But the boys make the
difference because they have don’t do well then girls in all the regions. If we compare with
the girls, the girls have achieved 71% compared of 62% of boys in the Northwest, and in
Maths and English 62.8.5% girls achieve more compared to 54.7% boys. Also in the East
Midlands boys have achieved 56.3% where as girls achieved 68.5% in 5+ A-C grades.
Introduction
I have started an internship at an educational charity. During this internship I will work with
big data to increase the charity’s programs. The charity wants to see what is different areas
GCSE result in England of boys and girls. I will use different mathematics to study the data
like making charts and tables, finding averages and using probability. These results I will be
written in a report, and it will be for whoever understand math so the charity can have a
bigger impact on education.
Pie Chart
Pie Chart is a circular graph which has been broken into slice to represent different data
based out of 100%, this is used for to visualise the data, which data have more percentage
than other one. Pie charts get to most used in business, bank, airport and other areas. For
example, business might use pie chart to show their market share, sales distribution or
different resource allocation and airports may use this pie chart to track the passenger
distribution of the airless. This helps them to understand the data quick way of different
types of data.
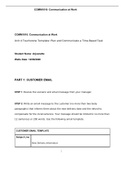
To show boys and girls performance of GCSE I will represent two pie charts because using
this chart the charity can see what is the percentage of each region of England. So this pie
chart will divide the full data into small sections to make understandable of each ones. This
chart data shape is like a pie with round circle and this name was given from pie because it
shows the data into different slice therefore it get called that. This will help the charity more
to understand about the boys and girls GCSE data of England different regions.
I get all the students data from official UK government website which shows who get at
least grade 5 in GCSE from A* to C. To make sure the data is correct and useful for analysis I
have removed any missing or unnecessary data from it.
, The GCSE results for boys in England is get analyse by looking at different statistics of
important numbers from each region to find out which region have did well. So if I look at
the data I can see that Northeast has the highest percentage because the girls they have
achieve 5+ A-C grade which is 58.7% but if we look at east midlands they have been the
lowest with 68.5%. Overall if we look at the mean percentage of the girls, they have been
achieve across all the regions is 71.9% and if we look at standard deviation is 2.6%.
If we look at the percentage of girls including Mathematics and English for Outer London
they have achieve 56.9% for 5+ A-C grades but on the other hand East Midlands got the
lowest with 48.7%. And mean for this overall is 51.9% and with standard deviation is 3.3%.
The percentage of girls being entered for GCSE it’s in inner London with highest percentage
number 97.0% and north west got the lowest which is 96.4%. The mean of girls being
entered is 96.7% this is for GCSE and with standard deviation is 0.2%.
If we do an analysis of GCSE results based on the region and different gender there is an
inconsistency with the data. If we look at London, they have done well with 75.5% which
they have achieve in 5+ A-C grade also with Maths and English 64.1%. But the boys make the
difference because they have don’t do well then girls in all the regions. If we compare with
the girls, the girls have achieved 71% compared of 62% of boys in the Northwest, and in
Maths and English 62.8.5% girls achieve more compared to 54.7% boys. Also in the East
Midlands boys have achieved 56.3% where as girls achieved 68.5% in 5+ A-C grades.