MARKETING
Refers to a process or system of researching into identifying customer needs and applying suitable prices,
product, place and promotion strategies in order to satisfy those needs profitably. It is a business function which
aims to link the business to the consumer and aims to get the right product having the right price to the right
place at the right time. Marketing is not only advertising and selling of goods and services. Market research is
done to find out what customers want or might want and what price they are prepared to pay for a product.
Marketing will then involve making sure that the design and production teams produce what consumers want
at a cost that will enable a price to be set so that the business can make profit.
Marketing Objectives
Refers to the goals or targets a business has that are concerned with marketing methods or issues. They
specify the results expected from marketing efforts and should be consistent with overall organisational/
corporate objectives. Basically, they are goals set for the marketing department. Effective marketing needs to
have a clear sense of direction.
Criteria for good marketing objectives
Must express realistic expectations
Must be expressed in clear, simple terms so that all marketing personnel understand exactly what they
want to achieve
Must be measurable
Must be time framed
Examples of marketing objectives
Increasing sales revenue or sales turnover by 5% by December 2020
To increase market share by 10% by end of 2019
To increase promotional budget by 7% by end of 2019
Relationship between corporate objective and marketing objectives
In Nestlé’s case, marketing objectives support the corporate objectives and all of them work together
,Importance of marketing objectives
They provide sense of direction for the marketing department
Progress can be monitored against these targets
Assist in decision making
Can be used in making marketing strategies ( long term plans established for achieving marketing
objectives
Demand and Supply
The primary goal for the marketing department is to meet customer wants profitably. Marketing staff must be
aware of how the free market works to determine the price. In a free market economy, price is determined by
the forces of demand and supply. Market is a place or system that enables producers of a product or service
to meet potential buyers and exchange these for money.
Demand
Refers to the units of a product that consumers are willing and able to buy at a given price in a given time
period. According to the law of demand, more units of a good are bought hen the product’s own price
decreases, ceteris paribus. Ceteris paribus means that ‘other things remaining constant’ Consumers’ demand
determines what producers should produce.
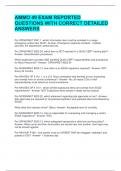
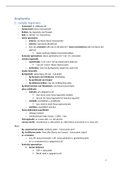
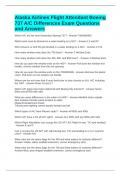
Demand curve: Refers to a graph which shows the relationship between quantity demanded and prices.
Demand curve is a graphical representation of demand schedule. It is the locus of all the points showing various
quantities of a commodity that a consumer is willing to buy at various levels of price, during a given period of time,
assuming no change in other factors
,When price decreases from P0 to P1, consumers increase their purchase of the product from Q0 to Q1. This is due
to income effect and substitution effect of a price change
Income Effect: low prices increases real income and consumers can now buy more
Substitution Effect: low price makes the consumers to switch over from substitutes to this product which is now
cheaper
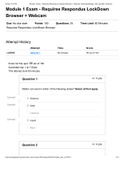
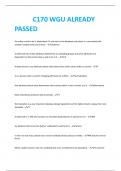
Shift in the demand curve
Usually demand curves are drawn based on the assumption that all other factors except price remain the same. But
there might be instances when demand may be affected by factors other than price. This will result in the change in
demand although the price will remain the same. This change in demand may cause the demand curve to SHIFT
inwards or outwards.
Shift of demand curve OUTWARDS shows an increase in demand at the same price level. It is known as
INCREASE IN DEMAND.
Shift of demand curve INWARDS shows that less is demanded at the same price level. It is known as a
FALL IN DEMAND.
, Factors Influencing Demand
i) Price of the product: price of the product is a key factor determining the demand. If the price
falls then demand will rise as the product becomes more affordable to customers so they buy
more of it. When products increase in price people will buy less of them and demand falls
ii) Price of other Products: some products are substitutes and others are complements.
Substitutes include butter and margarine. When the price of butter increases, people will buy
more margarine and less butter. There is a positive relationship between the price of one
product and the demand for a substitute good. When they are complements like tennis balls
and tennis rackets, a rise in the price of tennis balls will lead to a decrease in demand for tennis
rackets
iii) Advertising and promotion: a successful advertising campaign will create new customers and
remind existing customers to buy the product. The demand for the product will increase due
to promotional activities like by-one-get-one-free.
iv) Income level: as people gain higher incomes they will demand more of most products. People
will buy more of normal goods when income increases e.g meat. Demand for inferior goods
decreases as income increases e.g second-hand clothes.
v) Change in the size and composition of population: a rise in the population size will lead to an
increase the demand for goods and services.
vi) Weather conditions: in a hot day people will buy more ice creams and less of them on a cold
day
vii) Change in fashion and taste: Commodities for which the fashion is out are less in
demand as compared to commodities which are in fashion. In the same way, change in
taste of people affects the demand of a commodity.
viii) Changes in Income Tax: An increase in income tax will see a fall in demand as
people will have less money left in their pockets to spend whereas a decrease in
income tax will result in increase of demand for products and services because people
now have more disposable income.
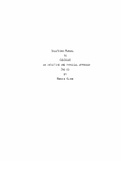
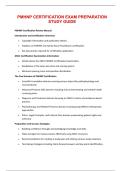
What is Supply?
Supply refers to the amount of goods and services firms or producers are willing and able to sell in the
market at a possible price. The law of supply states that when the price of a commodity rises, the supply
for it also increases. The higher the price for the good or service the more it will be supplied in the
market. The reason behind it is that more and more suppliers will be interested in supplying those good or
service whose prices are rising.
Supply Curve
Represents the relationship between the quantity supplied and the price if the product in form of a graph.
A supply schedule represents this relationship in form of a table. Supply curve plots the quantity of a
product supplied against its price.
Refers to a process or system of researching into identifying customer needs and applying suitable prices,
product, place and promotion strategies in order to satisfy those needs profitably. It is a business function which
aims to link the business to the consumer and aims to get the right product having the right price to the right
place at the right time. Marketing is not only advertising and selling of goods and services. Market research is
done to find out what customers want or might want and what price they are prepared to pay for a product.
Marketing will then involve making sure that the design and production teams produce what consumers want
at a cost that will enable a price to be set so that the business can make profit.
Marketing Objectives
Refers to the goals or targets a business has that are concerned with marketing methods or issues. They
specify the results expected from marketing efforts and should be consistent with overall organisational/
corporate objectives. Basically, they are goals set for the marketing department. Effective marketing needs to
have a clear sense of direction.
Criteria for good marketing objectives
Must express realistic expectations
Must be expressed in clear, simple terms so that all marketing personnel understand exactly what they
want to achieve
Must be measurable
Must be time framed
Examples of marketing objectives
Increasing sales revenue or sales turnover by 5% by December 2020
To increase market share by 10% by end of 2019
To increase promotional budget by 7% by end of 2019
Relationship between corporate objective and marketing objectives
In Nestlé’s case, marketing objectives support the corporate objectives and all of them work together
,Importance of marketing objectives
They provide sense of direction for the marketing department
Progress can be monitored against these targets
Assist in decision making
Can be used in making marketing strategies ( long term plans established for achieving marketing
objectives
Demand and Supply
The primary goal for the marketing department is to meet customer wants profitably. Marketing staff must be
aware of how the free market works to determine the price. In a free market economy, price is determined by
the forces of demand and supply. Market is a place or system that enables producers of a product or service
to meet potential buyers and exchange these for money.
Demand
Refers to the units of a product that consumers are willing and able to buy at a given price in a given time
period. According to the law of demand, more units of a good are bought hen the product’s own price
decreases, ceteris paribus. Ceteris paribus means that ‘other things remaining constant’ Consumers’ demand
determines what producers should produce.
Demand curve: Refers to a graph which shows the relationship between quantity demanded and prices.
Demand curve is a graphical representation of demand schedule. It is the locus of all the points showing various
quantities of a commodity that a consumer is willing to buy at various levels of price, during a given period of time,
assuming no change in other factors
,When price decreases from P0 to P1, consumers increase their purchase of the product from Q0 to Q1. This is due
to income effect and substitution effect of a price change
Income Effect: low prices increases real income and consumers can now buy more
Substitution Effect: low price makes the consumers to switch over from substitutes to this product which is now
cheaper
Shift in the demand curve
Usually demand curves are drawn based on the assumption that all other factors except price remain the same. But
there might be instances when demand may be affected by factors other than price. This will result in the change in
demand although the price will remain the same. This change in demand may cause the demand curve to SHIFT
inwards or outwards.
Shift of demand curve OUTWARDS shows an increase in demand at the same price level. It is known as
INCREASE IN DEMAND.
Shift of demand curve INWARDS shows that less is demanded at the same price level. It is known as a
FALL IN DEMAND.
, Factors Influencing Demand
i) Price of the product: price of the product is a key factor determining the demand. If the price
falls then demand will rise as the product becomes more affordable to customers so they buy
more of it. When products increase in price people will buy less of them and demand falls
ii) Price of other Products: some products are substitutes and others are complements.
Substitutes include butter and margarine. When the price of butter increases, people will buy
more margarine and less butter. There is a positive relationship between the price of one
product and the demand for a substitute good. When they are complements like tennis balls
and tennis rackets, a rise in the price of tennis balls will lead to a decrease in demand for tennis
rackets
iii) Advertising and promotion: a successful advertising campaign will create new customers and
remind existing customers to buy the product. The demand for the product will increase due
to promotional activities like by-one-get-one-free.
iv) Income level: as people gain higher incomes they will demand more of most products. People
will buy more of normal goods when income increases e.g meat. Demand for inferior goods
decreases as income increases e.g second-hand clothes.
v) Change in the size and composition of population: a rise in the population size will lead to an
increase the demand for goods and services.
vi) Weather conditions: in a hot day people will buy more ice creams and less of them on a cold
day
vii) Change in fashion and taste: Commodities for which the fashion is out are less in
demand as compared to commodities which are in fashion. In the same way, change in
taste of people affects the demand of a commodity.
viii) Changes in Income Tax: An increase in income tax will see a fall in demand as
people will have less money left in their pockets to spend whereas a decrease in
income tax will result in increase of demand for products and services because people
now have more disposable income.
What is Supply?
Supply refers to the amount of goods and services firms or producers are willing and able to sell in the
market at a possible price. The law of supply states that when the price of a commodity rises, the supply
for it also increases. The higher the price for the good or service the more it will be supplied in the
market. The reason behind it is that more and more suppliers will be interested in supplying those good or
service whose prices are rising.
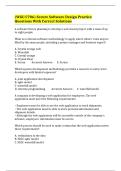
Supply Curve
Represents the relationship between the quantity supplied and the price if the product in form of a graph.
A supply schedule represents this relationship in form of a table. Supply curve plots the quantity of a
product supplied against its price.