Statistiek 2
,Herhaling:beschrijvendeeninferentiëlestatistiek..................................................................5
Introductie:quiz.......................................................................................................................5
Basicstatisticalconcepts.........................................................................................................7
Samplevspopulation.........................................................................................................7
Statischsignificantvsklinischrelevant..............................................................................7
Methodsofresearch..........................................................................................................7
Typesofdata.....................................................................................................................8
Summarizingdata..............................................................................................................8
1.Measuresoflocation................................................................................................8
Quartiles.......................................................................................................................8
2.Measuresofvariation...............................................................................................9
GraficRepresentation:boxplot....................................................................................9
Hypothesistestingforapopulationparameter........................................................................9
Algemeneprocedure.............................................................................................................10
1.Toetsingsprobleem.......................................................................................................10
2.Toetstingsgrootheid:eengepasteteststatistickiezen.................................................10
3a.Beslisregel-kritischpunt...........................................................................................11
3a.Beslisregel-p-waarde...............................................................................................11
Overzichtvanstatistischetestenom2ofmeermeans/proportiestevergelijken..................12
Introductie........................................................................................................................12
One-samplet-test............................................................................................................13
One-samplet-testinR...............................................................................................14
One-samplet-test:assumptiesenopmerkingen.......................................................14
Pairedt-test......................................................................................................................14
Pairedt-testinR........................................................................................................15
Unpairedt-test.................................................................................................................15
Unpairedt-testinR....................................................................................................15
Unpairedt-testassumptiesenopmerkingen.............................................................16
One-samplez-test............................................................................................................16
One-samplez-testinR..............................................................................................17
Two-samplez-test............................................................................................................17
Two-samplez-testinR..............................................................................................18
Two-samplez-test......................................................................................................18
Lineaireregressie......................................................................................................................19
Vanstatistischetestennaarregressiemodellen....................................................................19
Regressiemodellen................................................................................................................19
Enkelvoudigelineaireregressie.............................................................................................20
Voorbeeld:oestriolniveau..........................................................................................20
Demodelonderstellingen.................................................................................................21
Schattenvaninterceptenrichtingscoëfficiënt..................................................................22
InR..................................................................................................................................23
1
, erklarendestatistiekvoorαenß...................................................................................25
V
F-testvoorenkelvoudigelineaireregressie...........................................................................26
VoorbeeldFverdeling................................................................................................27
InR:opdrachten........................................................................................................28
T-testvoorenkelvoudigelineaireregressie...........................................................................29
RelatietussenTtestenglobaleFtest............................................................................30
Betrouwbaarheidsintervallen.................................................................................................30
BIvoorderegressieparametersαenß...........................................................................30
Betrouwbaarheidsband....................................................................................................32
Predictie-intervalvooryhorendebijeengegevenxwaarde.................................................32
PredictieintervalvoorJohn:........................................................................................35
WelkpuntzouhetsmalsteBIhebben?.....................................................................35
Correlatiecoëfficiënt...............................................................................................................36
InR..................................................................................................................................37
Verschilcorrelatieanalyseenenkelvoudigelineaireregressie...................................37
Verbandtussenbenr......................................................................................................37
Samenvattinglineaireregressie............................................................................................38
Meervoudigeregressie........................................................................................................40
Deregressievergelijking...................................................................................................40
Schattingvandeparameters...........................................................................................41
Interpretatievanregressiecoëfficiënten...........................................................................41
Gestandaardiseerderegressiecoëfficiënt........................................................................42
InR:uitlegverschillendetekens!...............................................................................43
Voorbeeldhypertensie...............................................................................................44
Meervoudiglineairregressiemodel..................................................................................44
Toetsenvoordehelegroepvanregressoren..................................................................45
ANOVA(analysisofvariance)tabel:..........................................................................46
InR:voorbeeldhypertensie.......................................................................................46
KleineANOVAtabelvoorlineairregressiemodel......................................................46
GroteANOVAtabel....................................................................................................47
Toetsenvooréénregressor.............................................................................................47
InR:...........................................................................................................................48
DepartiëleF-test.............................................................................................................49
InR:kleineANOVA....................................................................................................50
DUSELRvsMLRGlobaleFenTtest.............................................................................50
InR:groteANOVA.....................................................................................................51
BerekeningvanREGSS,RESSS,….......................................................................51
EXAMEN:.........................................................................................................................51
Interactie-effecten............................................................................................................52
Categorischevariabelen..................................................................................................53
Visualisatievaneeninteractie-effect..........................................................................54
2
, pdrachtlineaireregressie-Framingham............................................................................55
O
Examenvoorbeeldlineaireregressie.....................................................................................55
Veralgemeendelineaireregressie............................................................................................56
Inleiding............................................................................................................................56
Bernoulliverdeling(herhaling)...............................................................................................56
Voorbeeld:varicella....................................................................................................57
Logistischeregressie.............................................................................................................57
Veralgemeendlineairemodellen(GLM)................................................................................59
SchattenvanderegressieparametersinGLM................................................................59
Maximumlikelihoodmethode..........................................................................................60
Maximumlikelihoodmethode:oefening.....................................................................60
VoordeelvanML........................................................................................................61
Voorbeeld:varicella....................................................................................................61
InR:interpretatie.......................................................................................................61
InterpretatieR............................................................................................................62
InR............................................................................................................................63
Waldtest....................................................................................................................64
Betrouwbaarheidsinterval..........................................................................................65
Predictie...........................................................................................................................65
Voorbeeld...................................................................................................................66
EXAMENVOORBEELDOEFENINGLINEAIREREGRESSIE..............................................66
Samenvatting.........................................................................................................................67
Categorischevariabelen..................................................................................................68
InR:...........................................................................................................................68
Meervoudigelogistischeregressie........................................................................................70
R-voorbeeld:varicella................................................................................................70
Aikake’sInformationCriterion(AIC)......................................................................................73
Samenvatting:belangrijkomteweten...................................................................................73
Possoinregressie..................................................................................................................73
Voorbeeld:aantalinsectenopbonenplanten.............................................................74
Poissonverdeling.............................................................................................................74
Voorbeeld:SENICdata..............................................................................................75
Transformatie...................................................................................................................76
Veralgemeendelineairemodellen(GLM)........................................................................76
Voorbeeld:SENICdata..............................................................................................77
InR............................................................................................................................77
Interpretatie......................................................................................................................78
Toetsenvanhypothese:Wald-test...................................................................................78
Interpretatie......................................................................................................................79
Categorischevariabelen..................................................................................................79
R-voorbeeldSENIC:regio(eigenlijkaleenmeervoudigmodel)................................79
3
, ergelijkingmetlogistischeregressie........................................................................80
V
MeervoudigePoissonRegressie.....................................................................................80
R-voorbeeld:SENIC..................................................................................................81
Samenvattingtypes...................................................................................................................83
OverlevingsanalyseenCoxregressie.....................................................................................84
Overlevingsanalyse...............................................................................................................84
Definitieennotatie.....................................................................................................85
BelangrijkeconceptenI...................................................................................................85
BelangrijkeconceptenII..................................................................................................86
Voorbeeld...................................................................................................................86
Overlevingsfunctieof-curve............................................................................................87
Overlevingsanalysemetcensurering...............................................................................89
Typesvancensurering...............................................................................................89
Rechtsecensurering........................................................................................................91
Voorbeeld...................................................................................................................91
Voorbeeld:Duurvanremissieineenklinische..........................................................91
Niet-parametrischeschattingvanS(t*)......................................................................92
Overlevingsfunctieingevalvancensurering:Kaplan-Meier............................................92
Voorbeeld...................................................................................................................94
InR............................................................................................................................95
InR:Kaplan-meier.....................................................................................................96
Vergelijkenvanoverlevingsfuncties.................................................................................96
Regressievooroverlevingsanalyse.......................................................................................98
Coxproportionalhazardsmodel......................................................................................98
Schattenvanderegressieparameters.............................................................................98
Interpretatie......................................................................................................................99
Proportionalhazardsassumptie......................................................................................99
CoxmodelinR.........................................................................................................100
Predictie.........................................................................................................................102
Overzicht..................................................................................................................................103
4
,Herhaling: beschrijvende en inferentiële statistiek
Introductie: quiz
1. Which type of data is given in the following examples:
○ Male/female ⇒ kwalitatief nominaal
○ Number of heart beats per minute ⇒ kwantitatief discreet
○ Blood pressure ⇒ kwantitatief continu
2. What is the median value of the observations xi : 80,90,110,125,130,135?
⇒ (110+125)/2 = 117,5
3. How does the previous result change when adding an observation 140 to the
aforementioned series? ⇒ mediaan = 125
4. How do you calculate the sample mean and variance of the series?
⇒ variantie = waarde van spreiding
○ Waarden groter dan gem ⇒ pos bijdrage
○ Waarden kleiner dan gem ⇒ neg bijdrage
⇒ niet handig dus kijken naargekwadrateerde vormv variantieen dan delen door n-1
⇒ s² volgt een verdeling ⇒ geheel is stochastisch
5. Explain the difference between Xi and xi ?
○ Grote x: verdeling van alle mogelijke steekproef varianties = verdeling f
○ Kleine x: één waarde uit die verdeling (getal)
6.
5
,7.
een ongepaarde T-test of twee steekproeven T-test: er vanuit gaan dat normaal
⇒
verdeeld EN de variantie gelijk verdeeld is
8.
binaire uitkomst: 0 of 1 (ja of nee) DUS guy kwadraat test: wat is de proportie van
⇒
mensen die influenza krijgen in verschillende samenlevingen
6
,Basic statistical concepts
Sample vs population
Population
● A population refers to awell-defined group of subjectsin which the researcher is
interested from a scientific point of view
● Often, a population istoo large(or even infinite)to examine all subjects (too expensive,
too time-consuming, ...)
Sample
● A sample is afinite collection of study subjectsfor which observed characteristics and
response values are recorded
● Sample needs to berepresentativein order to providevalid inference at the population
level
Statisch significant vs klinisch relevant
Statistical significant:
● Statistical significance is based on measurements, observations, numbers, ...
● Statistical expertise is required
Clinical relevant:
● Which research questions are relevant to answer?Ishet verschil betekenisvol?
● Clinical relevance is determined usingdomain-specificexpertise
● Medical doctor, clinical investigator, lab-researcher, ...
⇒Statistical significant ≠ clinical relevant
Methods of research
Two large groups of research/studies:
1. Experimental studies
○ Studying theeffect of a treatment
○ Example: Clinical trials
■ Randomisation
■ Blinding
■ Placebo
○ Aim: Does a causal relationship exist?
2. Observational studies
○ No active intervention
○ Example: Has smoking an effect on the development of lung cancer?
○ In general no conclusions about causal relationships, onlyevidence of potential
associations
7
, Types of data
Qualitative data:
● Nominal data: categorical data used to classify anobject of characteristic, e.g., gender,
group membership, diagnosis
● Ordinal data: categorical data with specific ordering,e.g., opinion polls asking whether
we strongly disagree, disagree, agree or strongly agree
Quantitative (numeric) data:
● Discrete data: measurement or count (ordered) datafor which values cannot lie
arbitrarily close to each other, e.g., the number of pregnancies of a woman
● Continuous data: measurement data which could takeall values within a range, e.g.,
individual’s weight, or length
Summarizing data
1. Measures of location:
○ (arithmetic) mean
○ median
○ (quartiles)
2. Measures of variation:
○ variance and standard deviation
○ range
○ interquartile range (IQR)
1. Measures of location
ean
M
The (arithmetic) mean x of numeric observations x1,...,xn is given by ⇒
edian
M
The median of a series of n numeric observations is, after ordering of the values in this series,
● the middle value, if n is an odd number,
● the arithmetic mean of the two middle numbers, if n is even
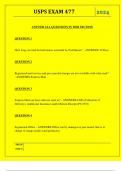
In case of observations in the following frequency table (n observations; p
different values of x) then the arithmetic mean is given by:
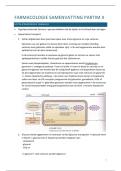
Quartiles
thefirst quartile Q1is the number with rank (n+1)/4
●
● thesecond quartile Q2is the number with rank (n+1)/2
● thethird quartile Q3is the number with rank 3(n+1)/4
Non-rationale ranks:
8
,Herhaling:beschrijvendeeninferentiëlestatistiek..................................................................5
Introductie:quiz.......................................................................................................................5
Basicstatisticalconcepts.........................................................................................................7
Samplevspopulation.........................................................................................................7
Statischsignificantvsklinischrelevant..............................................................................7
Methodsofresearch..........................................................................................................7
Typesofdata.....................................................................................................................8
Summarizingdata..............................................................................................................8
1.Measuresoflocation................................................................................................8
Quartiles.......................................................................................................................8
2.Measuresofvariation...............................................................................................9
GraficRepresentation:boxplot....................................................................................9
Hypothesistestingforapopulationparameter........................................................................9
Algemeneprocedure.............................................................................................................10
1.Toetsingsprobleem.......................................................................................................10
2.Toetstingsgrootheid:eengepasteteststatistickiezen.................................................10
3a.Beslisregel-kritischpunt...........................................................................................11
3a.Beslisregel-p-waarde...............................................................................................11
Overzichtvanstatistischetestenom2ofmeermeans/proportiestevergelijken..................12
Introductie........................................................................................................................12
One-samplet-test............................................................................................................13
One-samplet-testinR...............................................................................................14
One-samplet-test:assumptiesenopmerkingen.......................................................14
Pairedt-test......................................................................................................................14
Pairedt-testinR........................................................................................................15
Unpairedt-test.................................................................................................................15
Unpairedt-testinR....................................................................................................15
Unpairedt-testassumptiesenopmerkingen.............................................................16
One-samplez-test............................................................................................................16
One-samplez-testinR..............................................................................................17
Two-samplez-test............................................................................................................17
Two-samplez-testinR..............................................................................................18
Two-samplez-test......................................................................................................18
Lineaireregressie......................................................................................................................19
Vanstatistischetestennaarregressiemodellen....................................................................19
Regressiemodellen................................................................................................................19
Enkelvoudigelineaireregressie.............................................................................................20
Voorbeeld:oestriolniveau..........................................................................................20
Demodelonderstellingen.................................................................................................21
Schattenvaninterceptenrichtingscoëfficiënt..................................................................22
InR..................................................................................................................................23
1
, erklarendestatistiekvoorαenß...................................................................................25
V
F-testvoorenkelvoudigelineaireregressie...........................................................................26
VoorbeeldFverdeling................................................................................................27
InR:opdrachten........................................................................................................28
T-testvoorenkelvoudigelineaireregressie...........................................................................29
RelatietussenTtestenglobaleFtest............................................................................30
Betrouwbaarheidsintervallen.................................................................................................30
BIvoorderegressieparametersαenß...........................................................................30
Betrouwbaarheidsband....................................................................................................32
Predictie-intervalvooryhorendebijeengegevenxwaarde.................................................32
PredictieintervalvoorJohn:........................................................................................35
WelkpuntzouhetsmalsteBIhebben?.....................................................................35
Correlatiecoëfficiënt...............................................................................................................36
InR..................................................................................................................................37
Verschilcorrelatieanalyseenenkelvoudigelineaireregressie...................................37
Verbandtussenbenr......................................................................................................37
Samenvattinglineaireregressie............................................................................................38
Meervoudigeregressie........................................................................................................40
Deregressievergelijking...................................................................................................40
Schattingvandeparameters...........................................................................................41
Interpretatievanregressiecoëfficiënten...........................................................................41
Gestandaardiseerderegressiecoëfficiënt........................................................................42
InR:uitlegverschillendetekens!...............................................................................43
Voorbeeldhypertensie...............................................................................................44
Meervoudiglineairregressiemodel..................................................................................44
Toetsenvoordehelegroepvanregressoren..................................................................45
ANOVA(analysisofvariance)tabel:..........................................................................46
InR:voorbeeldhypertensie.......................................................................................46
KleineANOVAtabelvoorlineairregressiemodel......................................................46
GroteANOVAtabel....................................................................................................47
Toetsenvooréénregressor.............................................................................................47
InR:...........................................................................................................................48
DepartiëleF-test.............................................................................................................49
InR:kleineANOVA....................................................................................................50
DUSELRvsMLRGlobaleFenTtest.............................................................................50
InR:groteANOVA.....................................................................................................51
BerekeningvanREGSS,RESSS,….......................................................................51
EXAMEN:.........................................................................................................................51
Interactie-effecten............................................................................................................52
Categorischevariabelen..................................................................................................53
Visualisatievaneeninteractie-effect..........................................................................54
2
, pdrachtlineaireregressie-Framingham............................................................................55
O
Examenvoorbeeldlineaireregressie.....................................................................................55
Veralgemeendelineaireregressie............................................................................................56
Inleiding............................................................................................................................56
Bernoulliverdeling(herhaling)...............................................................................................56
Voorbeeld:varicella....................................................................................................57
Logistischeregressie.............................................................................................................57
Veralgemeendlineairemodellen(GLM)................................................................................59
SchattenvanderegressieparametersinGLM................................................................59
Maximumlikelihoodmethode..........................................................................................60
Maximumlikelihoodmethode:oefening.....................................................................60
VoordeelvanML........................................................................................................61
Voorbeeld:varicella....................................................................................................61
InR:interpretatie.......................................................................................................61
InterpretatieR............................................................................................................62
InR............................................................................................................................63
Waldtest....................................................................................................................64
Betrouwbaarheidsinterval..........................................................................................65
Predictie...........................................................................................................................65
Voorbeeld...................................................................................................................66
EXAMENVOORBEELDOEFENINGLINEAIREREGRESSIE..............................................66
Samenvatting.........................................................................................................................67
Categorischevariabelen..................................................................................................68
InR:...........................................................................................................................68
Meervoudigelogistischeregressie........................................................................................70
R-voorbeeld:varicella................................................................................................70
Aikake’sInformationCriterion(AIC)......................................................................................73
Samenvatting:belangrijkomteweten...................................................................................73
Possoinregressie..................................................................................................................73
Voorbeeld:aantalinsectenopbonenplanten.............................................................74
Poissonverdeling.............................................................................................................74
Voorbeeld:SENICdata..............................................................................................75
Transformatie...................................................................................................................76
Veralgemeendelineairemodellen(GLM)........................................................................76
Voorbeeld:SENICdata..............................................................................................77
InR............................................................................................................................77
Interpretatie......................................................................................................................78
Toetsenvanhypothese:Wald-test...................................................................................78
Interpretatie......................................................................................................................79
Categorischevariabelen..................................................................................................79
R-voorbeeldSENIC:regio(eigenlijkaleenmeervoudigmodel)................................79
3
, ergelijkingmetlogistischeregressie........................................................................80
V
MeervoudigePoissonRegressie.....................................................................................80
R-voorbeeld:SENIC..................................................................................................81
Samenvattingtypes...................................................................................................................83
OverlevingsanalyseenCoxregressie.....................................................................................84
Overlevingsanalyse...............................................................................................................84
Definitieennotatie.....................................................................................................85
BelangrijkeconceptenI...................................................................................................85
BelangrijkeconceptenII..................................................................................................86
Voorbeeld...................................................................................................................86
Overlevingsfunctieof-curve............................................................................................87
Overlevingsanalysemetcensurering...............................................................................89
Typesvancensurering...............................................................................................89
Rechtsecensurering........................................................................................................91
Voorbeeld...................................................................................................................91
Voorbeeld:Duurvanremissieineenklinische..........................................................91
Niet-parametrischeschattingvanS(t*)......................................................................92
Overlevingsfunctieingevalvancensurering:Kaplan-Meier............................................92
Voorbeeld...................................................................................................................94
InR............................................................................................................................95
InR:Kaplan-meier.....................................................................................................96
Vergelijkenvanoverlevingsfuncties.................................................................................96
Regressievooroverlevingsanalyse.......................................................................................98
Coxproportionalhazardsmodel......................................................................................98
Schattenvanderegressieparameters.............................................................................98
Interpretatie......................................................................................................................99
Proportionalhazardsassumptie......................................................................................99
CoxmodelinR.........................................................................................................100
Predictie.........................................................................................................................102
Overzicht..................................................................................................................................103
4
,Herhaling: beschrijvende en inferentiële statistiek
Introductie: quiz
1. Which type of data is given in the following examples:
○ Male/female ⇒ kwalitatief nominaal
○ Number of heart beats per minute ⇒ kwantitatief discreet
○ Blood pressure ⇒ kwantitatief continu
2. What is the median value of the observations xi : 80,90,110,125,130,135?
⇒ (110+125)/2 = 117,5
3. How does the previous result change when adding an observation 140 to the
aforementioned series? ⇒ mediaan = 125
4. How do you calculate the sample mean and variance of the series?
⇒ variantie = waarde van spreiding
○ Waarden groter dan gem ⇒ pos bijdrage
○ Waarden kleiner dan gem ⇒ neg bijdrage
⇒ niet handig dus kijken naargekwadrateerde vormv variantieen dan delen door n-1
⇒ s² volgt een verdeling ⇒ geheel is stochastisch
5. Explain the difference between Xi and xi ?
○ Grote x: verdeling van alle mogelijke steekproef varianties = verdeling f
○ Kleine x: één waarde uit die verdeling (getal)
6.
5
,7.
een ongepaarde T-test of twee steekproeven T-test: er vanuit gaan dat normaal
⇒
verdeeld EN de variantie gelijk verdeeld is
8.
binaire uitkomst: 0 of 1 (ja of nee) DUS guy kwadraat test: wat is de proportie van
⇒
mensen die influenza krijgen in verschillende samenlevingen
6
,Basic statistical concepts
Sample vs population
Population
● A population refers to awell-defined group of subjectsin which the researcher is
interested from a scientific point of view
● Often, a population istoo large(or even infinite)to examine all subjects (too expensive,
too time-consuming, ...)
Sample
● A sample is afinite collection of study subjectsfor which observed characteristics and
response values are recorded
● Sample needs to berepresentativein order to providevalid inference at the population
level
Statisch significant vs klinisch relevant
Statistical significant:
● Statistical significance is based on measurements, observations, numbers, ...
● Statistical expertise is required
Clinical relevant:
● Which research questions are relevant to answer?Ishet verschil betekenisvol?
● Clinical relevance is determined usingdomain-specificexpertise
● Medical doctor, clinical investigator, lab-researcher, ...
⇒Statistical significant ≠ clinical relevant
Methods of research
Two large groups of research/studies:
1. Experimental studies
○ Studying theeffect of a treatment
○ Example: Clinical trials
■ Randomisation
■ Blinding
■ Placebo
○ Aim: Does a causal relationship exist?
2. Observational studies
○ No active intervention
○ Example: Has smoking an effect on the development of lung cancer?
○ In general no conclusions about causal relationships, onlyevidence of potential
associations
7
, Types of data
Qualitative data:
● Nominal data: categorical data used to classify anobject of characteristic, e.g., gender,
group membership, diagnosis
● Ordinal data: categorical data with specific ordering,e.g., opinion polls asking whether
we strongly disagree, disagree, agree or strongly agree
Quantitative (numeric) data:
● Discrete data: measurement or count (ordered) datafor which values cannot lie
arbitrarily close to each other, e.g., the number of pregnancies of a woman
● Continuous data: measurement data which could takeall values within a range, e.g.,
individual’s weight, or length
Summarizing data
1. Measures of location:
○ (arithmetic) mean
○ median
○ (quartiles)
2. Measures of variation:
○ variance and standard deviation
○ range
○ interquartile range (IQR)
1. Measures of location
ean
M
The (arithmetic) mean x of numeric observations x1,...,xn is given by ⇒
edian
M
The median of a series of n numeric observations is, after ordering of the values in this series,
● the middle value, if n is an odd number,
● the arithmetic mean of the two middle numbers, if n is even
In case of observations in the following frequency table (n observations; p
different values of x) then the arithmetic mean is given by:
Quartiles
thefirst quartile Q1is the number with rank (n+1)/4
●
● thesecond quartile Q2is the number with rank (n+1)/2
● thethird quartile Q3is the number with rank 3(n+1)/4
Non-rationale ranks:
8