ISDS 2001 Statistical Methods and Models – SAMPLE FINAL EXAM
2025-2026 new update Louisiana State University
(NOTE: This sample exam contains questions from new
material since exam 2. See the objectives for the final exam,
including objectives for material from Exam 1 and Exam 2.
The final exam will NOT cover Module 1, which is a review of
ISDS 2000)
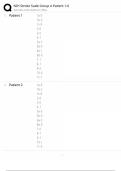
In June 2019, the miserable weather in a nearby South Louisiana town
played havoc on people’s plans and psyches, while at the same time,
resulted in a reduction in crime. An investigator at the local police
department believes that, in any particular month, there is a
relationship between the number of reported crimes/shootings and
number of rainy days, and decides to conduct a linear regression
analysis to test his suspicions. Use the following information from 2015
through 2019 to answer questions 1 – 16:
1. Which of the following statements is true?
a. The number of Shootings is the independent variable.
b. The number of rainy days is the dependent variable.
c. All of the above statements are true.
d. None of the above statements are true.
2. What is the least squares estimate of slope (b1)? (2 decimals)
a. -1.13 c. -1.82 e. none of the above
b. -0.92 d. -2.05
,3. What is the least squares estimate of the intercept (b0)? (2 decimals)
a. 23.92 c. 43.18 e. none of the above
b. 35.75 d. 12.51
4. What is Regression Sums-of-Squares (SSR)? (2 decimals)
a. 129.04 c. 691.18 e. none of the above
b. 200.98 d. 379.96
5. What is the Total Sums-of-Squares (SST)? (2 decimals)
a. 826.53 c. 510.37 e. none of the above
b. 136.28 d. 530.80
6. What is the coefficient of determination (R2)?
a. 0.2431 c. 0.3452 e. none of the above
b. 0.1873 d. 0.5857
7. What is the adjusted R2?
a. 0.1131 c. 0.2015 e. none of these
b. -0.0092 d. -0.1887
2
, 8. What is the standard error (Se)? (2 decimals)
a. 11.57 c. 14.34 e. none of the above
b. 3.65 d. 6.41
9. What is the standard deviation of the slope (Sb1)?
a. 0.9350 c. 0.6554 e. none of these
b. 1.1275 d. 1.4525
10. For testing the hypothesis set Ho: 1 = 0 versus H1: 1 ≠ 0, the t-test
statistic is (2 decimals):
a. -1.12 c. - 0.98 e. none of these
b. -2.45 d. -1.89
11. For testing the hypothesis set Ho: 1 = 0 versus H1: 1 ≠ 0, at 0.05
level of significance, the critical t-value(s) is(are):
a. ±2.353 c. ±3.182 e. ±4.303
b. ±2.015 d. ±2.571
3
2025-2026 new update Louisiana State University
(NOTE: This sample exam contains questions from new
material since exam 2. See the objectives for the final exam,
including objectives for material from Exam 1 and Exam 2.
The final exam will NOT cover Module 1, which is a review of
ISDS 2000)
In June 2019, the miserable weather in a nearby South Louisiana town
played havoc on people’s plans and psyches, while at the same time,
resulted in a reduction in crime. An investigator at the local police
department believes that, in any particular month, there is a
relationship between the number of reported crimes/shootings and
number of rainy days, and decides to conduct a linear regression
analysis to test his suspicions. Use the following information from 2015
through 2019 to answer questions 1 – 16:
1. Which of the following statements is true?
a. The number of Shootings is the independent variable.
b. The number of rainy days is the dependent variable.
c. All of the above statements are true.
d. None of the above statements are true.
2. What is the least squares estimate of slope (b1)? (2 decimals)
a. -1.13 c. -1.82 e. none of the above
b. -0.92 d. -2.05
,3. What is the least squares estimate of the intercept (b0)? (2 decimals)
a. 23.92 c. 43.18 e. none of the above
b. 35.75 d. 12.51
4. What is Regression Sums-of-Squares (SSR)? (2 decimals)
a. 129.04 c. 691.18 e. none of the above
b. 200.98 d. 379.96
5. What is the Total Sums-of-Squares (SST)? (2 decimals)
a. 826.53 c. 510.37 e. none of the above
b. 136.28 d. 530.80
6. What is the coefficient of determination (R2)?
a. 0.2431 c. 0.3452 e. none of the above
b. 0.1873 d. 0.5857
7. What is the adjusted R2?
a. 0.1131 c. 0.2015 e. none of these
b. -0.0092 d. -0.1887
2
, 8. What is the standard error (Se)? (2 decimals)
a. 11.57 c. 14.34 e. none of the above
b. 3.65 d. 6.41
9. What is the standard deviation of the slope (Sb1)?
a. 0.9350 c. 0.6554 e. none of these
b. 1.1275 d. 1.4525
10. For testing the hypothesis set Ho: 1 = 0 versus H1: 1 ≠ 0, the t-test
statistic is (2 decimals):
a. -1.12 c. - 0.98 e. none of these
b. -2.45 d. -1.89
11. For testing the hypothesis set Ho: 1 = 0 versus H1: 1 ≠ 0, at 0.05
level of significance, the critical t-value(s) is(are):
a. ±2.353 c. ±3.182 e. ±4.303
b. ±2.015 d. ±2.571
3