Data Science
Introduction (03/09)
Revolution of Scientific Method
Paradigms of scientific method:
1. Empiricism knowledge gained through observation and experimentation
2. Mathematical modelling uses mathematical equations and abstractions to represent real-
world systems; analyzing and predicting behavior through theoretical frameworks
3. Simulation creating computer-based models to imitate real-world processes; running
experiments in a virtual environment
A new paradigm: Data-intensive Scientific Discovery
4. Combining and analyzing data in novel ways is capable of tackling research questions that
could not be answered before
Big Data large complex data sets
The 4 V’s of big data, not always all 4, usually a combination of V’s
1. Volume: vast amount of data being generated
2. Velocity: the speed at which data is created and processed
3. Variety: different types and formats of data sources
4. Veracity: the quality (reliability and accuracy) of the data
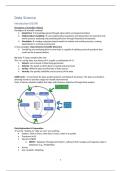
CRISP cycle = a framework for data analysis projects consisting of six phases. The steps are iterative,
allowing revisits to previous stages for model improvement.
Goal: to derive valuable insights that align with business objectives through data analysis
Data Exploration & Preparation
Just by “looking at” data we can’t see anything
Explore: what is there, what does it mean, what is its quality
Transform (in R)
Stored in DBMS
o DBMS = Database Management System, software that manages and organizes data in
databases (e.g., PostgreSQL)
Access
Use: Analytics Modeling
1
,From data to insights:
1. Formulate “Questions to data”
2. Imagine visualizations/reports
3. Design star schema(s) for (1) cube(s) by analyzing and for (2) fact(s) and dimensions
4. Create (empty) database with schema
5. Fill database by transforming sources
6. Use: Analytics (e.g., visualization) or (Predictive) modeling by connecting to the database
Data Mining
Techniques to automatically extract knowledge from data (by hand is simply not feasible anymore)
Supervised techniques = learn a target function by examples
o For decision tree mining, model = decision tree
o For deep learning, model = neural network with weights on connections
o For regression, model = (linear) function
Unsupervised techniques = find “obvious” patterns
2
,Topic DM: Data Mining (06/09)
Basics of Data Mining (DM)
What: discovering patterns, correlations, anomalies, insights, trends from (large) datasets
Purpose: to get insights of the data for decision-making, prediction and knowledge discovery
Related to:
Machine learning: developing algorithms that enable computers to learn from data and make
predictions or decisions
Statistical learning: providing a framework for understanding and analyzing data by modeling
relationships and making predictions based on statistical principles and techniques
Artificial Intelligence: creating intelligent systems that can perform tasks autonomously
Given lots of data
Discover patterns and models that are:
Valid: hold on new data with some certainty
Useful: should be possible to act on the item
Unexpected: non-obvious to the system
Understandable: humans should be able to interpret the pattern
Supervised learning = involves training a model for predicting or estimating (an output based on one
or more inputs)
Training data includes desired outputs / labels
Unsupervised learning = learn about relationships and structure of the data
Training data does not include desired outputs / unlabeled
Supervised Learning
Regression problem: output is continuous
Classification problem: output is a binary or categorical value (based on a probability)
Binary classification: two classes
Multi-class classification
Examples supervised:
prediction of credit card fraud (classification)
filtering out spam (classification)
convert hand-writing images into text (classification)
predicting house/property, stock market prices (regression)
Examples unsupervised
identify groups of customers with a certain purchasing behavior (clustering)
identify patterns like: if a customer buys X then there is a tendency to buy Y also (association)
Applications in the Medical Domain (supervised)
Automatically composed advice for patients based on questionnaires, diagnostic information
Automatic detection of atrial fibrillation
Scheduling of OR: prediction of surgery duration
Prediction of the time to fracture after the visit to osteoporosis poli
Prediction of occurrence of a post-operative infectious complication
Prediction of the length of stay after complex surgery
=C-C-R-R-C-R
Classification or Regression problems?
3
, Predicting the gender of a person by his/her handwriting style
Predicting house price based on area
Predicting the nationality of a person
Predicting the number of copies a music album will be sold next month
Predicting whether the stock price of a company will increase tomorrow
Predicting the probability of surviving a after hip fracture surgery
=C–R–C–R–C-C
Terminology
Input: feature, attribute, variable, covariate
Output: dependent variable, response variable, label
Feature selection: variable selection
Feature engineering: variable transform, dummy coding
Method: algorithm, approach or technique used to train a model on data (the estimator)
Model: the trained outcome from applying a method to a dataset (the estimate)
Training: process of teaching a model to make predictions or decisions by feeding it data
Learning: the outcome of the training process
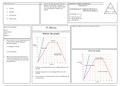
Training of a Model
Complex models aren’t always better: their effectiveness depends on performance.
Assessing how well a model works Validation of your model with unseen test data
Most simple method = Linear Regression
2 parameters 3 parameters
Complexity
The number of parameters in a model reflects its complexity and flexibility. More parameters allow
the model to capture finer details and nuances in the data.
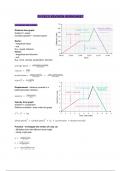
Non linear terms (e.g., higher order polynomials (= x3, x4 etc.)
More layers in your network
The more features in your model the better?
No, beware of overfitting
Overfitting = a too complex model (large number of parameters) to capture random fluctuations in
the training data poor performance on unseen data
4
Introduction (03/09)
Revolution of Scientific Method
Paradigms of scientific method:
1. Empiricism knowledge gained through observation and experimentation
2. Mathematical modelling uses mathematical equations and abstractions to represent real-
world systems; analyzing and predicting behavior through theoretical frameworks
3. Simulation creating computer-based models to imitate real-world processes; running
experiments in a virtual environment
A new paradigm: Data-intensive Scientific Discovery
4. Combining and analyzing data in novel ways is capable of tackling research questions that
could not be answered before
Big Data large complex data sets
The 4 V’s of big data, not always all 4, usually a combination of V’s
1. Volume: vast amount of data being generated
2. Velocity: the speed at which data is created and processed
3. Variety: different types and formats of data sources
4. Veracity: the quality (reliability and accuracy) of the data
CRISP cycle = a framework for data analysis projects consisting of six phases. The steps are iterative,
allowing revisits to previous stages for model improvement.
Goal: to derive valuable insights that align with business objectives through data analysis
Data Exploration & Preparation
Just by “looking at” data we can’t see anything
Explore: what is there, what does it mean, what is its quality
Transform (in R)
Stored in DBMS
o DBMS = Database Management System, software that manages and organizes data in
databases (e.g., PostgreSQL)
Access
Use: Analytics Modeling
1
,From data to insights:
1. Formulate “Questions to data”
2. Imagine visualizations/reports
3. Design star schema(s) for (1) cube(s) by analyzing and for (2) fact(s) and dimensions
4. Create (empty) database with schema
5. Fill database by transforming sources
6. Use: Analytics (e.g., visualization) or (Predictive) modeling by connecting to the database
Data Mining
Techniques to automatically extract knowledge from data (by hand is simply not feasible anymore)
Supervised techniques = learn a target function by examples
o For decision tree mining, model = decision tree
o For deep learning, model = neural network with weights on connections
o For regression, model = (linear) function
Unsupervised techniques = find “obvious” patterns
2
,Topic DM: Data Mining (06/09)
Basics of Data Mining (DM)
What: discovering patterns, correlations, anomalies, insights, trends from (large) datasets
Purpose: to get insights of the data for decision-making, prediction and knowledge discovery
Related to:
Machine learning: developing algorithms that enable computers to learn from data and make
predictions or decisions
Statistical learning: providing a framework for understanding and analyzing data by modeling
relationships and making predictions based on statistical principles and techniques
Artificial Intelligence: creating intelligent systems that can perform tasks autonomously
Given lots of data
Discover patterns and models that are:
Valid: hold on new data with some certainty
Useful: should be possible to act on the item
Unexpected: non-obvious to the system
Understandable: humans should be able to interpret the pattern
Supervised learning = involves training a model for predicting or estimating (an output based on one
or more inputs)
Training data includes desired outputs / labels
Unsupervised learning = learn about relationships and structure of the data
Training data does not include desired outputs / unlabeled
Supervised Learning
Regression problem: output is continuous
Classification problem: output is a binary or categorical value (based on a probability)
Binary classification: two classes
Multi-class classification
Examples supervised:
prediction of credit card fraud (classification)
filtering out spam (classification)
convert hand-writing images into text (classification)
predicting house/property, stock market prices (regression)
Examples unsupervised
identify groups of customers with a certain purchasing behavior (clustering)
identify patterns like: if a customer buys X then there is a tendency to buy Y also (association)
Applications in the Medical Domain (supervised)
Automatically composed advice for patients based on questionnaires, diagnostic information
Automatic detection of atrial fibrillation
Scheduling of OR: prediction of surgery duration
Prediction of the time to fracture after the visit to osteoporosis poli
Prediction of occurrence of a post-operative infectious complication
Prediction of the length of stay after complex surgery
=C-C-R-R-C-R
Classification or Regression problems?
3
, Predicting the gender of a person by his/her handwriting style
Predicting house price based on area
Predicting the nationality of a person
Predicting the number of copies a music album will be sold next month
Predicting whether the stock price of a company will increase tomorrow
Predicting the probability of surviving a after hip fracture surgery
=C–R–C–R–C-C
Terminology
Input: feature, attribute, variable, covariate
Output: dependent variable, response variable, label
Feature selection: variable selection
Feature engineering: variable transform, dummy coding
Method: algorithm, approach or technique used to train a model on data (the estimator)
Model: the trained outcome from applying a method to a dataset (the estimate)
Training: process of teaching a model to make predictions or decisions by feeding it data
Learning: the outcome of the training process
Training of a Model
Complex models aren’t always better: their effectiveness depends on performance.
Assessing how well a model works Validation of your model with unseen test data
Most simple method = Linear Regression
2 parameters 3 parameters
Complexity
The number of parameters in a model reflects its complexity and flexibility. More parameters allow
the model to capture finer details and nuances in the data.
Non linear terms (e.g., higher order polynomials (= x3, x4 etc.)
More layers in your network
The more features in your model the better?
No, beware of overfitting
Overfitting = a too complex model (large number of parameters) to capture random fluctuations in
the training data poor performance on unseen data
4