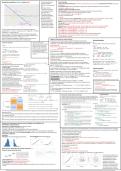
Unit 540 and 541 Tests in Rstudio
In green, those are tests for association, you choose depending on the type of Proportion test/binominal test: table (data_name$x), Binom.test(n_yes,total) Goodness of
variable: the fit test: Exp() Obs() Chisquare(,)
For the following codes assume that the dataset is called data_name, change it accordingly
If at least one variable is nominal: Cramer
dependent variable is called y, change it accordingly independent variable is called x
If both are scale and there is linearity: Pearson’s One sample t.test: We are comparing our sample mean with the population mean for
If both are scale and there is no linearity: Spearman’s example 6.5
In purple, those are tests for regression, so when you measure the effect of one or t.test(data_name$y, mu = 6.5)
more independent variable on the dependent variable: - compare CI with the average not with 0
If only one independent variable: Simple regression Paired samples: Assume we have 2 paired samples ex: Results on exam and retake
If more than one independent variable: Multiple regression 1st : Compute the differences in the right order (after – before)
diff = data_name$retake - data_name$exam
In Blue are those tests when the dependent variable is scale, then we choose
2nd: Do a one sample t-test
according to the amount of groups and whether the conditions/assumptions are t.test(diff)
good or not: ** You can directly compute a paired t.test: t.test(data_name$retake, data_name$exam,
1 group or 2 paired samples -> One sample t-test, 1 sample t-test of difference paired = TRUE)
2 groups -> check assumptions/conditions 2 samples : we measure the difference in reading skills among two teach methods
welch test if not equal variance or something wrong with sample size etc... Welch: t.test(data_name$y~ data_name$x, var.equal = FALSE)
two sample/ independent t-test if equal variance and sample size etc... Two sample: t.test(data_name$y~ data_name$x, var.equal = TRUE)
More than 2 samples:
More than two groups -> -> check assumptions/conditions
Welch anova: oneway.test(data_name$y ~ data_name$x, data = data_name, var.equal =
Welch anova if not equal variance or something wrong with sample size etc... FALSE)
Anova if equal variance, sample sizes are similar, no big differences expected.... Anova: 1. model = lm(data_name$y~ data_name$x, data=data_name) 2. summary(model)
data123$group1 = ifelse(data$group == "Group 1", 1, 0)
data123$group2 = ifelse(data$group == "Group 2", 1, 0)
data123$group3 = ifelse(data$group == "Group 3", 1, 0)
Now run the first and second code again without the new created reference group
Onafhankelijk (independent) = oorzaak, wat je verandert (x-as, horizontaal)
Afhankelijk (dependent) = gevolg, wat je meet (y-as, verticaal)
Oorzaak → Gevolg = Onafhankelijk → Afhankelijk
Empirical rule: 68% zit binnen 1 SD, 95% binnen 2, 99.7% binnen 3 standaardafwijkingen.
Statistic: Een waarde berekend uit een steekproef.
Parameter: Een waarde die hoort bij de hele populatie.
Population proportion (p): Het percentage mensen met een bepaald kenmerk in de hele
populatie.
Sample proportion (p ̂ ): Het percentage in jouw steekproef.
Sample distribution: De verdeling van alle waarden binnen één steekproef.
Sampling distribution: De verdeling van een statistiek over veel steekproeven.
Standard error (SE): Hoeveel een steekproefuitkomst kan schommelen als je het experiment
herhaalt.
Confidence interval (proportion): Het bereik waarin het echte populatiepercentage waarschijnlijk zit.
Margin of error: Hoeveel je steekproefwaarde maximaal kan afwijken van de echte waarde.
Population mean (μ): Het gemiddelde van de hele populatie.
Sample mean (x ̄ ): Het gemiddelde van jouw steekproef.
Sampling distribution of the mean: De verdeling van gemiddelden van heel veel steekproeven.
t-distribution: Een verdeling die lijkt op de normale verdeling, maar gebruik je bij kleine steekproeven.
Null hypothesis (H₀): De aanname dat er géén verschil of effect is.
t-value: Hoeveel het verschil is, vergeleken met de spreiding in de data.
p-value: De kans om dit resultaat (of extremer) te krijgen als H₀ klopt.
% difference: Het procentuele verschil tussen twee waarden.
Cramer’s V: Meet hoe sterk het verband is tussen twee categorische variabelen (0 = geen, 1 = sterk).
Chi-square statistic (χ²): Meet of er verschil is tussen wat je ziet en wat je zou verwachten.
Goodness-of-fit test: Test of de waargenomen verdeling overeenkomt met een verwachte verdeling.
Covariance: Geeft aan of twee variabelen samen stijgen of dalen, maar is moeilijk te interpreteren.
Pearson’s correlation (r): Meet hoe sterk het lineaire verband is tussen twee variabelen.
Spearman’s correlation (ρ): Meet of hogere rangen samengaan; geschikt bij uitschieters of ordinale data.
Non-parametric: Analyse die geen aannames maakt over de verdeling (zoals Spearman).
Linear equation: Formule om iets te voorspellen: y = a + bx
Intercept (a): De waarde van y als x = 0.
Slope (b): Hoeveel y verandert als x 1 eenheid stijgt.
Addition: Extra variabelen toevoegen aan het regressiemodel.
Ordinary least squares (OLS): Methode die de lijn zoekt met de kleinste fout (residu).
Two-sided test: Je test of het effect positief óf negatief kan zijn.
Independent sample t-test: Vergelijkt gemiddelden van twee onafhankelijke groepen.
Welch t-test: Variant van t-test als spreidingen verschillen.
ANOVA: Vergelijkt gemiddelden van 3 of meer groepen.
Welch ANOVA: ANOVA die ook werkt bij ongelijke spreidingen.
R-squared (R²): Hoeveel van de uitkomst het model verklaart (%).
Adjusted R-squared: Gecorrigeerde R² die rekening houdt met aantal variabelen.
F statistic / F-test: Test of het hele model beter is dan toeval.
Linear equations hypothesis
One sample: example: is the knowledge of
students significantly different than 6.6
Two paired sample: example: has the
knowledge improved after the master?
Two independent samples: example: the
average scores differs between dutch and
non-dutch (Yes and No equal variance)
More than 2 samples: example: the average
exam results differs between three groups