Reasoning:
If the items on the scale truly reflect some underlying, unobserved entity (‘a latent
variable’) we should be able to find some patterns of correlations between people’s
answers on those items.
In this case: if these items really reflect ‘statistics anxiety’, we have to find some patterns
of correlations between the self-reported answers that suggest they can be collectively
explained by ‘statistics anxiety’
Statistically, this is addressed through:
1. Factor analysis: used to identify factors (themes) in variables
2. Reliability Analysis
Factors = unobserved latent variables
Items = observable questions in surveys
If items really reflect unobserved variables (e.g., statistics anxiety)…
o …we should be able to find patterns of correlations between people’s
answers on those items!
Variance = how much influence a factor has
Number of factors
WE DO NOT USE “Based on parallel analysis”!
Eigenvalue = how much ‘variance’ in the data one factor (Eigenvector) can explain
Fixed number = when you know there is supposed to be 1 factor (= hypothesis)
Assumption checks
Bartlett’s test of sphericity: are variables correlated?
If so, you can proceed with the factor analysis
p < .05 is significant
KMO Measure of Sampling Adequacy : are variables suited based on the variance?
If partial correlations between variables are small, variables share common
factors
Close to 1 is good, should be at least 0.50/0.60
Factor loadings
Factor loadings = correlations between items and a factor
Sort loadings by size to read the table easier!
Additional output
Factor summary = to get the variance explained
Model fit measures = whether the factor structure is a good representation of
relationships among variables in your dataset
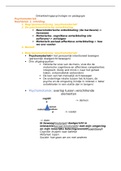
Initial eigenvalues = how much variance each factor explains
Scree plot = plots the factors from large to small
Rule: use all factors before the inflection point, because those factors have a
higher variance
Decision criteria:
If the items on the scale truly reflect some underlying, unobserved entity (‘a latent
variable’) we should be able to find some patterns of correlations between people’s
answers on those items.
In this case: if these items really reflect ‘statistics anxiety’, we have to find some patterns
of correlations between the self-reported answers that suggest they can be collectively
explained by ‘statistics anxiety’
Statistically, this is addressed through:
1. Factor analysis: used to identify factors (themes) in variables
2. Reliability Analysis
Factors = unobserved latent variables
Items = observable questions in surveys
If items really reflect unobserved variables (e.g., statistics anxiety)…
o …we should be able to find patterns of correlations between people’s
answers on those items!
Variance = how much influence a factor has
Number of factors
WE DO NOT USE “Based on parallel analysis”!
Eigenvalue = how much ‘variance’ in the data one factor (Eigenvector) can explain
Fixed number = when you know there is supposed to be 1 factor (= hypothesis)
Assumption checks
Bartlett’s test of sphericity: are variables correlated?
If so, you can proceed with the factor analysis
p < .05 is significant
KMO Measure of Sampling Adequacy : are variables suited based on the variance?
If partial correlations between variables are small, variables share common
factors
Close to 1 is good, should be at least 0.50/0.60
Factor loadings
Factor loadings = correlations between items and a factor
Sort loadings by size to read the table easier!
Additional output
Factor summary = to get the variance explained
Model fit measures = whether the factor structure is a good representation of
relationships among variables in your dataset
Initial eigenvalues = how much variance each factor explains
Scree plot = plots the factors from large to small
Rule: use all factors before the inflection point, because those factors have a
higher variance
Decision criteria: