Lab 1: Measurement, Uncertainty, and Scaling
Name_____________________________________ Date_______________
Assignment Submission Directions: Download this assignment sheet and complete by answering all questions. You will
need to access the simulations website in order to complete the labs. When completed, save your work and upload the
document to the Assignment Upload for graded submission. 50 points.
Items in red font require submission into a pre populated text box shown as Click here to enter text. (Note: you do not
need to fill this one in, for directions purposes only.)
Part A: Using Transformations to Graph Linear Functions
Simulation Website: https://phet.colorado.edu/sims/html/graphing-lines/latest/graphing-lines_en.html
Learning Goals
● Identify and use a vertical shift to graph a linear function.
● Identify and use a vertical stretch or compression to graph a linear function.
● Combine transformations to graph a linear function.
Activity
1. Explore the slope-intercept screen for 5 minutes by clicking around the screen and playing with the simulation.
Part 1A: The Parent Function
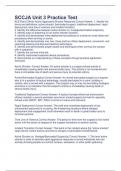
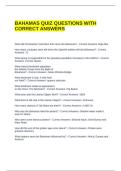
2. Check the ‘𝑦 = 𝑥’ checkbox and play around with the simulation. A linear parent function is the
equation𝑦 = 𝑥. How would you describe the linear parent function, 𝑦 = 𝑥? Cut and paste a screenshot of the parent
𝑦 = 𝑥 function and describe the line you see on the screen.
𝑦 = 𝑥Parent Function Screenshot
, Lab 1: Measurement, Uncertainty, and Scaling
Describe your linear parent function here.
A linear parent function is the simplest equation of a function where y=x or f(x)=x where it is a straight line that
passes through the origin, the domain and range of linear parent function is all real numbers and describes a
relationship between two objects that are linearly proportional to one another where the independent variable is x
and the dependent variable is y.
Part 2A: Changing the b-value
3. Now, manipulate the equation editor by changing the values in the parent equation:
1
● To write an equation such as y = x + 4; you need to set the fraction to read y = x + 4.
1
● This reads as 1 in the numerator and 1 in the denominator.
● The 4 in this case is the b-value.
● Use the ‘Save Line’ button after each equation.
●
Graph each equation below on the same screen and ‘save line’ after each line. For each function below, indicate the
resulting line as it compares to the parent function by selecting the appropriate check box(es).
Name_____________________________________ Date_______________
Assignment Submission Directions: Download this assignment sheet and complete by answering all questions. You will
need to access the simulations website in order to complete the labs. When completed, save your work and upload the
document to the Assignment Upload for graded submission. 50 points.
Items in red font require submission into a pre populated text box shown as Click here to enter text. (Note: you do not
need to fill this one in, for directions purposes only.)
Part A: Using Transformations to Graph Linear Functions
Simulation Website: https://phet.colorado.edu/sims/html/graphing-lines/latest/graphing-lines_en.html
Learning Goals
● Identify and use a vertical shift to graph a linear function.
● Identify and use a vertical stretch or compression to graph a linear function.
● Combine transformations to graph a linear function.
Activity
1. Explore the slope-intercept screen for 5 minutes by clicking around the screen and playing with the simulation.
Part 1A: The Parent Function
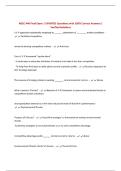
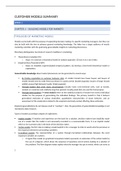
2. Check the ‘𝑦 = 𝑥’ checkbox and play around with the simulation. A linear parent function is the
equation𝑦 = 𝑥. How would you describe the linear parent function, 𝑦 = 𝑥? Cut and paste a screenshot of the parent
𝑦 = 𝑥 function and describe the line you see on the screen.
𝑦 = 𝑥Parent Function Screenshot
, Lab 1: Measurement, Uncertainty, and Scaling
Describe your linear parent function here.
A linear parent function is the simplest equation of a function where y=x or f(x)=x where it is a straight line that
passes through the origin, the domain and range of linear parent function is all real numbers and describes a
relationship between two objects that are linearly proportional to one another where the independent variable is x
and the dependent variable is y.
Part 2A: Changing the b-value
3. Now, manipulate the equation editor by changing the values in the parent equation:
1
● To write an equation such as y = x + 4; you need to set the fraction to read y = x + 4.
1
● This reads as 1 in the numerator and 1 in the denominator.
● The 4 in this case is the b-value.
● Use the ‘Save Line’ button after each equation.
●
Graph each equation below on the same screen and ‘save line’ after each line. For each function below, indicate the
resulting line as it compares to the parent function by selecting the appropriate check box(es).