2
AS LEVEL DEPTH IN PHYSICS A
H156/02 MAY 2018 QUESTION PAPER
AND MARK SCHEME REVISED 2025
Answer all the questions.
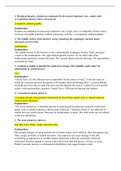
1 Fig. 1 shows how the velocity v of a car varies with time t as the car approaches a road junction.
15
v / m s–1
10
5
0
0 1 2 3 4 5 6 t/s
Fig. 1
(a) Explain what feature of the graph shows the deceleration of the car and that the deceleration
is constant after 1.5 s.
...................................................................................................................................................
...................................................................................................................................................
. ............................................................................................................................................................ [2]
(b) The driver of the car applies the brakes at a distance of 20 m from the „stop line‟ at the junction.
Calculate the distance s of the car relative to the stop line when the car comes to a stop.
© OCR 2018
, 3
s = ...................................................... m [3]
© OCR 2018 Turn over
, 4
2* A student wishes to determine experimentally the efficiency of a small low-voltage DC motor. The
motor is used to lift light loads.
Describe with the aid of a suitable diagram how an experiment to determine the efficiency of the
electric motor can be safely conducted, and how the data can be analysed.
..........................................................................................................................................................
..........................................................................................................................................................
..........................................................................................................................................................
..........................................................................................................................................................
..........................................................................................................................................................
..........................................................................................................................................................
..........................................................................................................................................................
..........................................................................................................................................................
..........................................................................................................................................................
..........................................................................................................................................................
..........................................................................................................................................................
..........................................................................................................................................................
..........................................................................................................................................................
..........................................................................................................................................................
..........................................................................................................................................................
..................................................................................................................................................................... [6]
© OCR 2018
, 5
3 A student is carrying out an experiment in the laboratory to determine the acceleration of free
fall g. The student drops a small steel ball from rest and records the time t taken for the ball to fall
through a vertical distance h.
The results for different vertical distances are shown in the table below.
h/m t/s t2 / s2
0.660 0.365 0.133
0.720 0.385 0.148
0.780 0.400 0.160
0.840 0.415 0.172
0.900 0.430
0.960 0.445 0.198
(a) Describe and explain how the student could use standard laboratory equipment to make
accurate measurements of h and t.
...................................................................................................................................................
...................................................................................................................................................
...................................................................................................................................................
...................................................................................................................................................
...................................................................................................................................................
. ............................................................................................................................................................ [4]
(b) Complete the table for the missing value of t2. [1]
(c) Fig. 3 shows the graph of t2 (y-axis) against h (x-axis).
(i) Plot the missing data point and draw the straight line of best fit. [2]
(ii) Determine the gradient of the straight line of best fit.
gradient = .............................................. s2 m–1 [1]
© OCR 2018 Turn over
AS LEVEL DEPTH IN PHYSICS A
H156/02 MAY 2018 QUESTION PAPER
AND MARK SCHEME REVISED 2025
Answer all the questions.
1 Fig. 1 shows how the velocity v of a car varies with time t as the car approaches a road junction.
15
v / m s–1
10
5
0
0 1 2 3 4 5 6 t/s
Fig. 1
(a) Explain what feature of the graph shows the deceleration of the car and that the deceleration
is constant after 1.5 s.
...................................................................................................................................................
...................................................................................................................................................
. ............................................................................................................................................................ [2]
(b) The driver of the car applies the brakes at a distance of 20 m from the „stop line‟ at the junction.
Calculate the distance s of the car relative to the stop line when the car comes to a stop.
© OCR 2018
, 3
s = ...................................................... m [3]
© OCR 2018 Turn over
, 4
2* A student wishes to determine experimentally the efficiency of a small low-voltage DC motor. The
motor is used to lift light loads.
Describe with the aid of a suitable diagram how an experiment to determine the efficiency of the
electric motor can be safely conducted, and how the data can be analysed.
..........................................................................................................................................................
..........................................................................................................................................................
..........................................................................................................................................................
..........................................................................................................................................................
..........................................................................................................................................................
..........................................................................................................................................................
..........................................................................................................................................................
..........................................................................................................................................................
..........................................................................................................................................................
..........................................................................................................................................................
..........................................................................................................................................................
..........................................................................................................................................................
..........................................................................................................................................................
..........................................................................................................................................................
..........................................................................................................................................................
..................................................................................................................................................................... [6]
© OCR 2018
, 5
3 A student is carrying out an experiment in the laboratory to determine the acceleration of free
fall g. The student drops a small steel ball from rest and records the time t taken for the ball to fall
through a vertical distance h.
The results for different vertical distances are shown in the table below.
h/m t/s t2 / s2
0.660 0.365 0.133
0.720 0.385 0.148
0.780 0.400 0.160
0.840 0.415 0.172
0.900 0.430
0.960 0.445 0.198
(a) Describe and explain how the student could use standard laboratory equipment to make
accurate measurements of h and t.
...................................................................................................................................................
...................................................................................................................................................
...................................................................................................................................................
...................................................................................................................................................
...................................................................................................................................................
. ............................................................................................................................................................ [4]
(b) Complete the table for the missing value of t2. [1]
(c) Fig. 3 shows the graph of t2 (y-axis) against h (x-axis).
(i) Plot the missing data point and draw the straight line of best fit. [2]
(ii) Determine the gradient of the straight line of best fit.
gradient = .............................................. s2 m–1 [1]
© OCR 2018 Turn over