MSc Finance: Empirical Methods in Finance
Inhoudsopgave
MSc Finance: Empirical Methods in Finance ................................................................................................... 1
Block 0: Introduction .......................................................................................................................................... 3
Block 1: Maths and Stats Review ....................................................................................................................... 3
Block 2: Bivariate CLRM ................................................................................................................................... 10
Block 3: Hypothesis testing .............................................................................................................................. 19
Block 4: Multivariate CLRM .............................................................................................................................. 25
Block 5: Causal inferences ................................................................................................................................ 47
Block 6: Discrete choice models ....................................................................................................................... 66
Block 7: Machine learning ................................................................................................................................ 77
Stata Q&A Lectures ...................................................................................................................................... 82
Q&A 1 ............................................................................................................................................................... 82
Q&A 2 ............................................................................................................................................................... 83
Q&A 3 ............................................................................................................................................................... 85
Q&A 4 ............................................................................................................................................................... 88
Q&A 5 ............................................................................................................................................................... 90
Q&A 6 ............................................................................................................................................................... 95
Q&A 7 ............................................................................................................................................................. 101
Q&A 8 assignment ......................................................................................................................................... 102
Q&A 9 ............................................................................................................................................................. 105
1
, ........................... 108
Q&A 10 ........................................................................................................................................................... 108
Stata Web Lectures .................................................................................................................................... 112
Video part 1 .................................................................................................................................................... 112
Video part 2 .................................................................................................................................................... 112
Video part 3 .................................................................................................................................................... 115
Book and literature .................................................................................................................................... 121
Readings Empirical Methods Lecture 1 .......................................................................................................... 121
Notes Chapter 2, 3, 5, 6 (for lecture 2) ........................................................................................................... 122
2
,Block 0: Introduction
The world’s most valuable resource is no longer oil, but data.
Examples of how econometrics can help us with problems in finance:
Suppose you work for a central bank and you are asked to forecast how interest rates,
inflation rates, or GDP will evolve in the next quarter or year
- Collecting past data on these variables, econometrics gives you the statistical tools
necessary to forecast them
Econometrics aims at determining relationships between different variables.
Main uses of financial econometrics:
- Testing theories in finance
- Forecasting future values of financial variables
- Determining the relationship between financial variables
Steps financial econometrics:
- Formulate a clear question of interest
- Construct an economic/financial model
o Model: mathematical equation that describes the relationship between y
(output variable) and x (input variable).
- Find data for the variables that you need
- Turn your economic/financial model into an econometric model, this means
specifying the form of the function f(x).
o 𝑦 = ∝ + 𝛽𝑥 + 𝑢
§ ∝ 𝑎𝑛𝑑 𝛽 – parameters that describe sign and magnitude of the effect
of x on y.
§ U is the error term, including all unobserved factors other than x that
affect y.
Three types of data analysis of financial problems:
1. Cross-sectional data: data on one or more variables collected at a single point in
time.
a. Example: CEO’s salaries and past performance from measured on single point
in time.
2. Time series data: data on one/more variables collected at many points in time.
a. Example: weekly % return on the NYSE composite index between year 1900
and 2000.
3. Panel data: time series for each cross-sectional member of the dataset.
a. Example: housing rental prices and town population across US college towns
in 1980 and 1990.
Block 1: Maths and Stats Review
3
, Random variables: one that can take on any value from a given set, and value is at least in
part determined by chance.
3 types:
1. Bernoulli/binary: can only take the value 0 or 1.
a. E.g. tossing a coin (head or tail)
2. Discrete: takes only a finite number of values.
a. E.g. outcomes of rolling a dice (1-6)
3. Continuous: takes infinitely many values.
a. E.g. price change of a stock, which is technically a discrete random variable,
but it can take so many values that it can be seen as continuous.
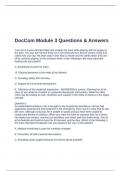
E.g. Sum of rolling two dice (2-12)
We can calculate the probability of each possible score occurring, called P(X).
2 and 12 will occur with a probability of 1/6*1/6 = 0.028
Hence, P(X=2) = 0.028 and P(X=12) = 0.028
3 and 11 will occur with probability of 1/6*1/6 + 1/6*1/6 = 0.056
You have either 1+2 or 2+1 and 5+6 or 6+5.
Probability distribution function: diagram showing the probability of each possible score.
pj = P(X = j), where j=2,…., 12
If we increase the number of dice towards infinity, X converges towards a continuous
random variable.
PDF: summarizes the information on the possible outcomes of X and corresponding
probabilities.
f(x) = P (X = x)
Often, however, we do not want to know the exact probability, but in the probability that
the probability of a random variable that lies below or above a certain value.
- E.g. probability below 4?
o P2 + p3 = 0.028 + 0.025 = 0.084
- F(x) = P(x £ X)
Joint distribution is a joint PDF of (X,Y).
𝑓-,/ (𝑥, 𝑦) = 𝑃 (𝑋 = 𝑥, 𝑌 = 𝑦) = 𝑃 (𝑋 = 𝑥)𝑃(𝑌 = 𝑦)
In the two dice case, the joint probability of each dice giving a score of 1 = 1/6* 1/6 = 0.028.
Two variables are independent if knowing the outcome of X doesn’t change the probabilities
of the possible outcomes of Y, and vice versa.
- This means, the formula above is valid.
If two random variables are dependent, we can study how X affects Y by looking at the
conditional distribution Y given X, described by their conditional PDF.
𝑓-,/ (𝑥, 𝑦)
𝑓-| / (𝑦|𝑥) = = 𝑃 (𝑌 = 𝑦|𝑋 = 𝑥)
𝑓𝑥(𝑥)
4
Inhoudsopgave
MSc Finance: Empirical Methods in Finance ................................................................................................... 1
Block 0: Introduction .......................................................................................................................................... 3
Block 1: Maths and Stats Review ....................................................................................................................... 3
Block 2: Bivariate CLRM ................................................................................................................................... 10
Block 3: Hypothesis testing .............................................................................................................................. 19
Block 4: Multivariate CLRM .............................................................................................................................. 25
Block 5: Causal inferences ................................................................................................................................ 47
Block 6: Discrete choice models ....................................................................................................................... 66
Block 7: Machine learning ................................................................................................................................ 77
Stata Q&A Lectures ...................................................................................................................................... 82
Q&A 1 ............................................................................................................................................................... 82
Q&A 2 ............................................................................................................................................................... 83
Q&A 3 ............................................................................................................................................................... 85
Q&A 4 ............................................................................................................................................................... 88
Q&A 5 ............................................................................................................................................................... 90
Q&A 6 ............................................................................................................................................................... 95
Q&A 7 ............................................................................................................................................................. 101
Q&A 8 assignment ......................................................................................................................................... 102
Q&A 9 ............................................................................................................................................................. 105
1
, ........................... 108
Q&A 10 ........................................................................................................................................................... 108
Stata Web Lectures .................................................................................................................................... 112
Video part 1 .................................................................................................................................................... 112
Video part 2 .................................................................................................................................................... 112
Video part 3 .................................................................................................................................................... 115
Book and literature .................................................................................................................................... 121
Readings Empirical Methods Lecture 1 .......................................................................................................... 121
Notes Chapter 2, 3, 5, 6 (for lecture 2) ........................................................................................................... 122
2
,Block 0: Introduction
The world’s most valuable resource is no longer oil, but data.
Examples of how econometrics can help us with problems in finance:
Suppose you work for a central bank and you are asked to forecast how interest rates,
inflation rates, or GDP will evolve in the next quarter or year
- Collecting past data on these variables, econometrics gives you the statistical tools
necessary to forecast them
Econometrics aims at determining relationships between different variables.
Main uses of financial econometrics:
- Testing theories in finance
- Forecasting future values of financial variables
- Determining the relationship between financial variables
Steps financial econometrics:
- Formulate a clear question of interest
- Construct an economic/financial model
o Model: mathematical equation that describes the relationship between y
(output variable) and x (input variable).
- Find data for the variables that you need
- Turn your economic/financial model into an econometric model, this means
specifying the form of the function f(x).
o 𝑦 = ∝ + 𝛽𝑥 + 𝑢
§ ∝ 𝑎𝑛𝑑 𝛽 – parameters that describe sign and magnitude of the effect
of x on y.
§ U is the error term, including all unobserved factors other than x that
affect y.
Three types of data analysis of financial problems:
1. Cross-sectional data: data on one or more variables collected at a single point in
time.
a. Example: CEO’s salaries and past performance from measured on single point
in time.
2. Time series data: data on one/more variables collected at many points in time.
a. Example: weekly % return on the NYSE composite index between year 1900
and 2000.
3. Panel data: time series for each cross-sectional member of the dataset.
a. Example: housing rental prices and town population across US college towns
in 1980 and 1990.
Block 1: Maths and Stats Review
3
, Random variables: one that can take on any value from a given set, and value is at least in
part determined by chance.
3 types:
1. Bernoulli/binary: can only take the value 0 or 1.
a. E.g. tossing a coin (head or tail)
2. Discrete: takes only a finite number of values.
a. E.g. outcomes of rolling a dice (1-6)
3. Continuous: takes infinitely many values.
a. E.g. price change of a stock, which is technically a discrete random variable,
but it can take so many values that it can be seen as continuous.
E.g. Sum of rolling two dice (2-12)
We can calculate the probability of each possible score occurring, called P(X).
2 and 12 will occur with a probability of 1/6*1/6 = 0.028
Hence, P(X=2) = 0.028 and P(X=12) = 0.028
3 and 11 will occur with probability of 1/6*1/6 + 1/6*1/6 = 0.056
You have either 1+2 or 2+1 and 5+6 or 6+5.
Probability distribution function: diagram showing the probability of each possible score.
pj = P(X = j), where j=2,…., 12
If we increase the number of dice towards infinity, X converges towards a continuous
random variable.
PDF: summarizes the information on the possible outcomes of X and corresponding
probabilities.
f(x) = P (X = x)
Often, however, we do not want to know the exact probability, but in the probability that
the probability of a random variable that lies below or above a certain value.
- E.g. probability below 4?
o P2 + p3 = 0.028 + 0.025 = 0.084
- F(x) = P(x £ X)
Joint distribution is a joint PDF of (X,Y).
𝑓-,/ (𝑥, 𝑦) = 𝑃 (𝑋 = 𝑥, 𝑌 = 𝑦) = 𝑃 (𝑋 = 𝑥)𝑃(𝑌 = 𝑦)
In the two dice case, the joint probability of each dice giving a score of 1 = 1/6* 1/6 = 0.028.
Two variables are independent if knowing the outcome of X doesn’t change the probabilities
of the possible outcomes of Y, and vice versa.
- This means, the formula above is valid.
If two random variables are dependent, we can study how X affects Y by looking at the
conditional distribution Y given X, described by their conditional PDF.
𝑓-,/ (𝑥, 𝑦)
𝑓-| / (𝑦|𝑥) = = 𝑃 (𝑌 = 𝑦|𝑋 = 𝑥)
𝑓𝑥(𝑥)
4