Microeconomics for Development
1. Poverty and inequality: measurement (PL)
2. Poverty and inequality: policy (PL)
3. Firms, workers and missing markets (RO)
4. Corruption, rents and political economy (RO
5. Risk and Development (MP)
6. Microcredit and finance (MP)
Lecture 1&2 Poverty and inequality: measurement. Meaning lines, measures and profiles
Articles: Ravallion, Martin (forthcoming) The Economics of Poverty (Oxford
University Press) Chapters 3-5 (For lecture 1,2 & 3)
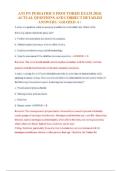
“Most people in the world are poor. If we knew the economy of being poor, we would know much of
the economics that really matters” - Nobel Laureate Theodore Schultz, 1981
What do we mean by poverty?
Common definition (we focus on this term in this course):
◦ Lack of command over commodities; “..a severe constriction of the choice set [over
commodities]” (Harold Watts)
More narrow definition:
◦ Lack of specific consumptions (e.g. too little food energy intake; too little of specific
nutrients; too little leisure.)
Less narrow definition:
◦ Poverty as lack of “welfare” e.g., lack of “capability”: inability to achieve certain
“functionings” (“beings and doings”) (Amartya Sen)
Why measure poverty?
Inform program design
◦ Who are the target groups?
◦ How should transfers be allocated?
◦ How much impact will they have on poverty?
Monitoring progress
◦ Has poverty increased? Did growth help the poor?
Foster evidence based policy making
◦ Who were the losers and winners from economy-wide policy reforms? (ex-ante vs.
ex-post)
◦ Social spending: who benefits from government subsides? Who will be hurt by
retrenchment?
But…can inform or misinform anti-poverty policies
Building blocks of poverty measurement
◦ The economic welfare indicator
◦ The poverty line
◦ Summary measures of poverty
The poverty profile
◦ Robustness to household size and composition
◦ Constructing a spatially disaggregated profile of poverty
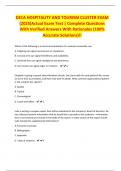
Poverty measurement involves 3 steps:
, 1. Identify the “space” in which poverty is going to be measured
2. Identify “who are poor”: dichotomize (verdelen) the population between poor and non-
poor.
Tool: Poverty line (z): Poor = x i< z Non-poor = x i ≥ z
3. Aggregation (opeenhopen?): Construct an index that summarizes the information and gives
an overall picture of poverty.
A poverty measure is a function: P ( x , z ) : D x → R, which indicates the level of poverty in
each distribution.
Poverty (depending on distribution x and the poverty line) R = real number set (between
minus infinity and plus infinity).
Sources of info
Survey data
Differ according to:
◦ - the unit of observation (household/individual),
◦ - no. observations over time (cross-section/panel panel = overtime and cross
section);
◦ - living standards indicator (consumption/income)
Different snapshots: not the same households over time.
Surveys are updated / refined; what is the implication?
Issues to consider
Survey design
◦ Does the sample frame cover the entire population? different from census.
◦ Is there a response bias if the person thinks I have to reply in a certain way to
conform to social norms? Rich people do not reply as often, time is worth more than
answering a survey.
◦ What is the sample structure (clustering, stratification)? can be based on villages
etc. Household survey is almost never random, needs to be stratified.
One random sample in rural area and one in villages: need for clustering.
Goods coverage and valuation
◦ Is the goods coverage comprehensive?
◦ Is the survey integrated (e.g. price analysis)?
Integrated: all kinds of demographic info. Bag/ bunch potatoes.
◦ Are there valuation problems?
Variability and the time period of survey
◦ Is there significant variability over time? Seasonality in command for goods and
services: agricultural
◦ Can this be encompassed within the recall period?
, ◦ What are the implications for the choice between consumption and income?
Inter-personal comparisons
◦ Is consumption a sufficient statistic?
◦ What other variables matter? (Prices, demographics, publicly provided goods)
The welfare indicator: It's a choice, each one can be defended
Consumption expenditures per capita: Conventional approach 'wb approach'
o capture destruction of goods and services by use
o consumption valued at prices paid (whether there was an actual transaction)
o Consumption: actual consumption vs. Income: possibility to consume but not actual
consumption. People can maybe consume more, but save.
Income per capita
o maximum possible expenditure on consumption without depleting assets
o Poor indicator when incomes vary; hard to measure
o Income: less popular for development countries. Hard to use when there is a lot of
seasonal variation. And large amount of informality. Hard when people are active in
a variety of occupations.
Nutritional indicators
o "Welfarist" critique (welfare and nutrition are different things); nutritional
requirements/ anthropometric standards.
What is sen’s functionality? Poverty as lack of “welfare” e.g., lack of “capability”: inability to achieve
certain “functionings”
Common:
Use a comprehensive consumption measure, spanning consumption space
Choice between income and consumption is largely driven by the greater likelihood of
accuracy of information on consumption.
, Consumption is more 'smooth' compared to income: often more reliable in development
countries: 'what did you consume last week' vs. 'what is your income per year'.
Recognize the limitations of consumption based measures; look for supplementary measures,
especially access to public services, subjective welfare as a clue to measuring objective welfare.
The consumption measure
The consumption measure is the foundation over which all poverty analysis rests
Principles:
◦ Goal is to be able to rank individuals in terms of welfare
◦ Should be comprehensive
◦ Retain transparency and credibility
Important clarifications
◦ Consumption: destruction of goods and services by use (not price)
◦ Expenditure: consumption valued at prices paid
◦ Income: maximum possible expenditure on consumption without depleting assets
Steps:
Construct a food consumption measure
◦ Rice for example can be made at home : purchased or produced, both incl.
Add basic non-food items (from consumption module)
◦ Non food: clothing soap etc
Add other non-food items (other modules)
◦ Do not confuse investment with consumption expenditures
◦ Are they the kinda items that contribute to well being: so dont incl. fertilizer
Add housing expenditures
◦ Often based on hedonic regressions, given that owner occupiers do not report rent
payments
◦ Shelter can be very different in value. Know what rent they pay. Many are not
renting.
◦ 'Hypothetical rent'. Or econometric estimate. If you have the characteristics, you can
forecast.
Add use-value of consumer durables
◦ Impute a stream of consumption services rather than purchase expense of “lumpy”
consumption items
◦ Lumpy: klonterig. For example car: investment 1 time. Convert ownership in a stream
of consumption services.
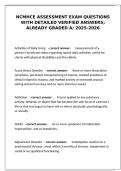
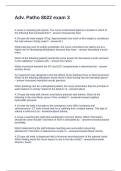
The Headcount With Alternative Consumption Aggregations
Consumption
Aggregate Ecuador Nepal Brazil
Food Spending plus
Basic Non-Food Spending 1.00 1.00 1.00
Food plus Basic Non-Food 0.85 0.91 0.89
Spending Including Energy
and Education Spending
1. Poverty and inequality: measurement (PL)
2. Poverty and inequality: policy (PL)
3. Firms, workers and missing markets (RO)
4. Corruption, rents and political economy (RO
5. Risk and Development (MP)
6. Microcredit and finance (MP)
Lecture 1&2 Poverty and inequality: measurement. Meaning lines, measures and profiles
Articles: Ravallion, Martin (forthcoming) The Economics of Poverty (Oxford
University Press) Chapters 3-5 (For lecture 1,2 & 3)
“Most people in the world are poor. If we knew the economy of being poor, we would know much of
the economics that really matters” - Nobel Laureate Theodore Schultz, 1981
What do we mean by poverty?
Common definition (we focus on this term in this course):
◦ Lack of command over commodities; “..a severe constriction of the choice set [over
commodities]” (Harold Watts)
More narrow definition:
◦ Lack of specific consumptions (e.g. too little food energy intake; too little of specific
nutrients; too little leisure.)
Less narrow definition:
◦ Poverty as lack of “welfare” e.g., lack of “capability”: inability to achieve certain
“functionings” (“beings and doings”) (Amartya Sen)
Why measure poverty?
Inform program design
◦ Who are the target groups?
◦ How should transfers be allocated?
◦ How much impact will they have on poverty?
Monitoring progress
◦ Has poverty increased? Did growth help the poor?
Foster evidence based policy making
◦ Who were the losers and winners from economy-wide policy reforms? (ex-ante vs.
ex-post)
◦ Social spending: who benefits from government subsides? Who will be hurt by
retrenchment?
But…can inform or misinform anti-poverty policies
Building blocks of poverty measurement
◦ The economic welfare indicator
◦ The poverty line
◦ Summary measures of poverty
The poverty profile
◦ Robustness to household size and composition
◦ Constructing a spatially disaggregated profile of poverty
Poverty measurement involves 3 steps:
, 1. Identify the “space” in which poverty is going to be measured
2. Identify “who are poor”: dichotomize (verdelen) the population between poor and non-
poor.
Tool: Poverty line (z): Poor = x i< z Non-poor = x i ≥ z
3. Aggregation (opeenhopen?): Construct an index that summarizes the information and gives
an overall picture of poverty.
A poverty measure is a function: P ( x , z ) : D x → R, which indicates the level of poverty in
each distribution.
Poverty (depending on distribution x and the poverty line) R = real number set (between
minus infinity and plus infinity).
Sources of info
Survey data
Differ according to:
◦ - the unit of observation (household/individual),
◦ - no. observations over time (cross-section/panel panel = overtime and cross
section);
◦ - living standards indicator (consumption/income)
Different snapshots: not the same households over time.
Surveys are updated / refined; what is the implication?
Issues to consider
Survey design
◦ Does the sample frame cover the entire population? different from census.
◦ Is there a response bias if the person thinks I have to reply in a certain way to
conform to social norms? Rich people do not reply as often, time is worth more than
answering a survey.
◦ What is the sample structure (clustering, stratification)? can be based on villages
etc. Household survey is almost never random, needs to be stratified.
One random sample in rural area and one in villages: need for clustering.
Goods coverage and valuation
◦ Is the goods coverage comprehensive?
◦ Is the survey integrated (e.g. price analysis)?
Integrated: all kinds of demographic info. Bag/ bunch potatoes.
◦ Are there valuation problems?
Variability and the time period of survey
◦ Is there significant variability over time? Seasonality in command for goods and
services: agricultural
◦ Can this be encompassed within the recall period?
, ◦ What are the implications for the choice between consumption and income?
Inter-personal comparisons
◦ Is consumption a sufficient statistic?
◦ What other variables matter? (Prices, demographics, publicly provided goods)
The welfare indicator: It's a choice, each one can be defended
Consumption expenditures per capita: Conventional approach 'wb approach'
o capture destruction of goods and services by use
o consumption valued at prices paid (whether there was an actual transaction)
o Consumption: actual consumption vs. Income: possibility to consume but not actual
consumption. People can maybe consume more, but save.
Income per capita
o maximum possible expenditure on consumption without depleting assets
o Poor indicator when incomes vary; hard to measure
o Income: less popular for development countries. Hard to use when there is a lot of
seasonal variation. And large amount of informality. Hard when people are active in
a variety of occupations.
Nutritional indicators
o "Welfarist" critique (welfare and nutrition are different things); nutritional
requirements/ anthropometric standards.
What is sen’s functionality? Poverty as lack of “welfare” e.g., lack of “capability”: inability to achieve
certain “functionings”
Common:
Use a comprehensive consumption measure, spanning consumption space
Choice between income and consumption is largely driven by the greater likelihood of
accuracy of information on consumption.
, Consumption is more 'smooth' compared to income: often more reliable in development
countries: 'what did you consume last week' vs. 'what is your income per year'.
Recognize the limitations of consumption based measures; look for supplementary measures,
especially access to public services, subjective welfare as a clue to measuring objective welfare.
The consumption measure
The consumption measure is the foundation over which all poverty analysis rests
Principles:
◦ Goal is to be able to rank individuals in terms of welfare
◦ Should be comprehensive
◦ Retain transparency and credibility
Important clarifications
◦ Consumption: destruction of goods and services by use (not price)
◦ Expenditure: consumption valued at prices paid
◦ Income: maximum possible expenditure on consumption without depleting assets
Steps:
Construct a food consumption measure
◦ Rice for example can be made at home : purchased or produced, both incl.
Add basic non-food items (from consumption module)
◦ Non food: clothing soap etc
Add other non-food items (other modules)
◦ Do not confuse investment with consumption expenditures
◦ Are they the kinda items that contribute to well being: so dont incl. fertilizer
Add housing expenditures
◦ Often based on hedonic regressions, given that owner occupiers do not report rent
payments
◦ Shelter can be very different in value. Know what rent they pay. Many are not
renting.
◦ 'Hypothetical rent'. Or econometric estimate. If you have the characteristics, you can
forecast.
Add use-value of consumer durables
◦ Impute a stream of consumption services rather than purchase expense of “lumpy”
consumption items
◦ Lumpy: klonterig. For example car: investment 1 time. Convert ownership in a stream
of consumption services.
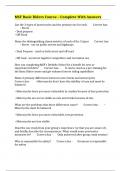
The Headcount With Alternative Consumption Aggregations
Consumption
Aggregate Ecuador Nepal Brazil
Food Spending plus
Basic Non-Food Spending 1.00 1.00 1.00
Food plus Basic Non-Food 0.85 0.91 0.89
Spending Including Energy
and Education Spending