Unit 1 - Waves & Sound
Lesson 2: Wave Diagrams
REVIEW:
❖ A wave is a transfer of energy taking the form of disturbance -- examples include sound
waves, light waves, seismic waves, etc.
❖ There are 3 types of vibrations which cause the same waves:
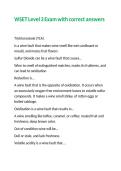
❖ Transverse Vibrations → when an object vibrates perpendicular to the line of
equilibrium (up and down) i.e. a playground swing
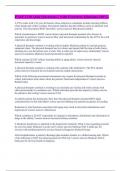
❖ Longitudinal Vibrations → when an object vibrates parallel to the line of
equilibrium (side to side) i.e. a spring
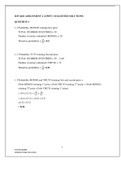
❖ Torsional Vibrations → when an object twists around line of equilibrium (in
circles) i.e. a tetherball game
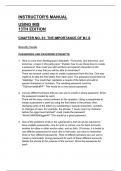
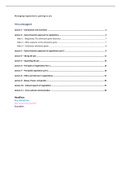
A wave diagram typically displays the different parts of a wave which can be measured and
identified when experimenting with various vibrations.
➔ The rest position, otherwise known as equilibrium, refers to the undisturbed state of
the medium in which the vibration is occurring.
➔ The peak is the maximum point of the wave
➔ The trough is the lowest point of the wave
➔ The amplitude is the distance between the peak/trough and the line of equilibrium
➔ The wavelength is the distance from one peak to the next, or one trough to the next.
SUMMARY
❖ All waves have the characteristics listed above
❖ Wave diagrams are used to determine key characteristics of various waves
Lesson 2: Wave Diagrams
REVIEW:
❖ A wave is a transfer of energy taking the form of disturbance -- examples include sound
waves, light waves, seismic waves, etc.
❖ There are 3 types of vibrations which cause the same waves:
❖ Transverse Vibrations → when an object vibrates perpendicular to the line of
equilibrium (up and down) i.e. a playground swing
❖ Longitudinal Vibrations → when an object vibrates parallel to the line of
equilibrium (side to side) i.e. a spring
❖ Torsional Vibrations → when an object twists around line of equilibrium (in
circles) i.e. a tetherball game
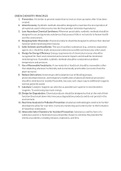
A wave diagram typically displays the different parts of a wave which can be measured and
identified when experimenting with various vibrations.
➔ The rest position, otherwise known as equilibrium, refers to the undisturbed state of
the medium in which the vibration is occurring.
➔ The peak is the maximum point of the wave
➔ The trough is the lowest point of the wave
➔ The amplitude is the distance between the peak/trough and the line of equilibrium
➔ The wavelength is the distance from one peak to the next, or one trough to the next.
SUMMARY
❖ All waves have the characteristics listed above
❖ Wave diagrams are used to determine key characteristics of various waves