Week 1: Ch.1 Introduction, Ch2. Microbial Structures, Ch.3 Growth & Environment
Chapter 1: Introduction to Microbiology and Data Analysis
Microbiology: “Microbiology is the study of microscopic organisms such as bacteria, viruses, archarea,
fungi and protozoa.
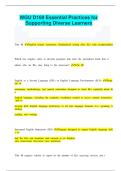
Branches of Microbiology:
Distinguishing fields of Microbiology:
Environmental Microbiology: the impact of microbes on the environment. Concerns how pathogens are
spread but not how they affect a host.
● In the “natural” environment.
● Researchers at Cornell University found a new species of soil bacteria that’s good at breaking
down organic matter, including carcinogens, e.g. polycyclic aromatic hydrocarbons (PAHs).
Microbial Ecology: study of microbes in their respective niches (where they live) ex: contributions made,
resources needed.
● Story of Heliobacter Pylori (Heliobacter: Genus/Pylori: Species)
Medical Microbiology: How microbes cause human disease
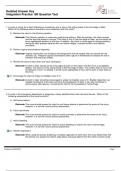
Classifying Organisms:
● Acellular (i.e. Non-cellular) cannot live independently, and cannot be included in the Tree below.
,Prokaryote: No nucleus, No membrane-bound organelle, often circular chromosome
Eukaryote: True nucleus, membrane-bound organelles, linear chromosome
Diversity and Model Organisms:
Note: Archaea and Bacteria are prokaryotes however, Eukaryotes appeared to have evolved from
Archaea.
Model Organisms:
● It’s impossible to be an expert on all species so we learn the basic
principles by studying one species in detail.
● Not all principles apply but a lot of them are often conserved.
Types of Data:
Interpreting Qualitative Data:
● Is there a control group?
● Is there a reference group to compare to?
● Are there characteristics that you know of that you can identify in the treatment or control?
● Are there features that you expected to be in the treatment?
, ● Are there features that you did not expect in the treatment?
Interpreting Quantitative Data:
● Data is a collection of values that relate to a particular subject
● How to analyze the data depends on the data type.
1. What is being measured on the y-axis and shown on the x-axis?
2. What is the control group?
3. How do the treatment groups differ from control? Increase decrease?
4. Are the differences observed actually significant?
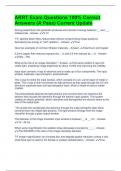
Interpreting Differences on a Data Set in MICB 211:
Option 1: look for Asterisks) (*) first. Statistical differences are shown by symbol [asterisks, p-values, etc]
or NS = not significant
Option 2: Error Bars show variability in the data.
● Non-overlapping error bars may indicate a difference.
● Standard deviations can give a sense if the difference is significant based on
whether they overlap.
Option 3: If missing error bars and statistics, we can assume there is a difference by
if the means are different. E.g. glas pipette is higher than all other measurements.
This method is not acceptable outside of MICB 211.
1. Asterisk (*) – show data is statistically different than comparator.
2. Error bars – show variability.
3. Brackets – shows which data are being compared.
4. NS – not statistically significant
Note: number of * indicate lower p value e.g. * p = 0.05; ** p = 0.01, *** p
= 0.001 etc
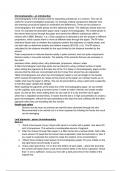
, Scientific Controls:
Type Details Expected Result
Experimental Control Receives no treatment to ensure Negative (no bacterial killing)
sterility, etc
Negative Control: does not Treated with chemical that does Negative (no bacterial killing)
produce intended result not kill bacteria
Positive Control: produces Treated with chemical that does Positive (bacterial killing)
intended result kill bacteria
Chapter 1: Introduction to Microbiology and Data Analysis
Microbiology: “Microbiology is the study of microscopic organisms such as bacteria, viruses, archarea,
fungi and protozoa.
Branches of Microbiology:
Distinguishing fields of Microbiology:
Environmental Microbiology: the impact of microbes on the environment. Concerns how pathogens are
spread but not how they affect a host.
● In the “natural” environment.
● Researchers at Cornell University found a new species of soil bacteria that’s good at breaking
down organic matter, including carcinogens, e.g. polycyclic aromatic hydrocarbons (PAHs).
Microbial Ecology: study of microbes in their respective niches (where they live) ex: contributions made,
resources needed.
● Story of Heliobacter Pylori (Heliobacter: Genus/Pylori: Species)
Medical Microbiology: How microbes cause human disease
Classifying Organisms:
● Acellular (i.e. Non-cellular) cannot live independently, and cannot be included in the Tree below.
,Prokaryote: No nucleus, No membrane-bound organelle, often circular chromosome
Eukaryote: True nucleus, membrane-bound organelles, linear chromosome
Diversity and Model Organisms:
Note: Archaea and Bacteria are prokaryotes however, Eukaryotes appeared to have evolved from
Archaea.
Model Organisms:
● It’s impossible to be an expert on all species so we learn the basic
principles by studying one species in detail.
● Not all principles apply but a lot of them are often conserved.
Types of Data:
Interpreting Qualitative Data:
● Is there a control group?
● Is there a reference group to compare to?
● Are there characteristics that you know of that you can identify in the treatment or control?
● Are there features that you expected to be in the treatment?
, ● Are there features that you did not expect in the treatment?
Interpreting Quantitative Data:
● Data is a collection of values that relate to a particular subject
● How to analyze the data depends on the data type.
1. What is being measured on the y-axis and shown on the x-axis?
2. What is the control group?
3. How do the treatment groups differ from control? Increase decrease?
4. Are the differences observed actually significant?
Interpreting Differences on a Data Set in MICB 211:
Option 1: look for Asterisks) (*) first. Statistical differences are shown by symbol [asterisks, p-values, etc]
or NS = not significant
Option 2: Error Bars show variability in the data.
● Non-overlapping error bars may indicate a difference.
● Standard deviations can give a sense if the difference is significant based on
whether they overlap.
Option 3: If missing error bars and statistics, we can assume there is a difference by
if the means are different. E.g. glas pipette is higher than all other measurements.
This method is not acceptable outside of MICB 211.
1. Asterisk (*) – show data is statistically different than comparator.
2. Error bars – show variability.
3. Brackets – shows which data are being compared.
4. NS – not statistically significant
Note: number of * indicate lower p value e.g. * p = 0.05; ** p = 0.01, *** p
= 0.001 etc
, Scientific Controls:
Type Details Expected Result
Experimental Control Receives no treatment to ensure Negative (no bacterial killing)
sterility, etc
Negative Control: does not Treated with chemical that does Negative (no bacterial killing)
produce intended result not kill bacteria
Positive Control: produces Treated with chemical that does Positive (bacterial killing)
intended result kill bacteria