Week 1. Introduction / How does a data visualization work?
Artikel van Franconeri, S. L., Padilla, L. M., Shah, P., Zacks, J. M., & Hullman, J. (2021). The
science of visual data communication: What works. Psychological Science in the Public
Interest
Introduction to Effective Data Visualization
Data visualizations serve as powerful tools for communicating complex information by leveraging the
human visual system's remarkable capacity to detect patterns and extract meaning quickly. The
article by Franconeri et al. (2021) synthesizes decades of research across psychology, cognitive
science, and information design to establish evidence-based principles for creating visualizations that
are accurate, efficient, and meaningful for diverse audiences.
At the core of effective visualization lies an understanding of how people perceive and interpret
graphical representations. Unlike textual or numerical data which requires sequential processing,
visualizations allow for parallel processing of information, enabling viewers to grasp overall trends
and outliers almost instantaneously. This advantage, however, comes with important warnings -
poorly designed visualizations can distort data, mislead interpretations, or overwhelm viewers'
cognitive capacities.
Franconeri emphasizes that visualization design must consider three fundamental aspects:
perceptual accuracy (ensuring viewers correctly decode the represented values), perceptual
efficiency (optimizing how quickly and easily information can be extracted), and conceptual
understanding (helping viewers connect visual patterns to their real-world meaning). These
principles apply across contexts from scientific publications to news media and business
communications.
The Power and Mechanisms of Visual Perception
Human visual perception excels at extracting statistical properties from visual displays. Within
fractions of a second, viewers can estimate averages, identify ranges, and spot outliers in visualized
data. This capability stems from our visual system's ability to process information in parallel across
the visual field, a stark contrast to the serial processing required for reading numbers or text.
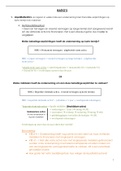
The article presents compelling demonstrations of this phenomenon. One striking example is
Anscombe's Quartet (left side of figure 1), where four distinct datasets share identical statistical
properties (same mean, variance, and correlation) but reveal radically different patterns when
visualized. This underscores how visualizations can uncover aspects of data that summary statistics
obscure: a visualisation of data reveals more information about the data than the descriptive
statistics may reveal. An even more dramatic demonstration comes from Matejka and Fitzmaurice's
(2017) work showing nine completely different scatterplots (including one resembling a dinosaur)
that share identical statistical properties down to the second decimal place. (right side of the
picture)
1
,
Visual channels vary significantly in their effectiveness for conveying quantitative information.
Position along a common scale (as in bar charts) allows for the most precise judgments, followed by
length, area, angle, and finally color intensity. These differences in perceptual precision have
profound implications for design choices. For instance, while color may be excellent for distinguishing
categories, it performs poorly when precise quantitative comparisons are needed.
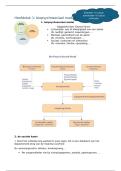
The five visual properties ranked from most to least perceptually accurate, as outlined by Franconeri
et al. (2021), are:
1. Position (e.g., on a common scale)
2. Length
3. Angle/Slope
4. Area
5. Volume/Color Saturation
Note: This hierarchy reflects human perceptual precision, with position being the most accurate for
quantitative comparisons and volume/color saturation the least.
2
,
Avoiding Perceptual Distortions and Pitfalls
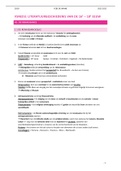
One of the most common and consequential design errors involves axis truncation. When y-axes
don't start at zero, they can dramatically exaggerate perceived differences between values. The
article cites a telling example from Fox News coverage of Obamacare (see figure below alinea)
enrollment, where a truncated y-axis made the difference between 6 million and 7 million
enrollments appear three times larger than it actually was. Similar distortions appear in climate
change visualizations that use inappropriate baselines, potentially minimizing the apparent severity
of temperature increases.
Area-based visualizations present another frequent source of misinterpretation. When values are
encoded by the area of circles or squares, viewers often misjudge magnitudes because they
intuitively compare lengths or diameters rather than areas. The article addresses how this can lead to
underestimating or overestimating values by factors of two or more. This effect is particularly
problematic in bubble charts and other area-based visualizations.
Line graphs, while excellent for showing trends, introduce their own perceptual quirks. A notable
illusion occurs when comparing lines with steep slopes - the vertical distance between lines appears
to decrease as values increase, even when the actual difference remains constant. This makes it
difficult to accurately assess changes in gaps between trends over time.
3
,
Color perception introduces additional challenges. The same color can appear dramatically different
depending on its background due to contrast effects. Moreover, about 4% of the population
experiences some form of color vision deficiency, most commonly difficulty distinguishing red and
green. The article demonstrates how color-coded scatterplots that are meaningful to typical viewers
may become completely uninterpretable to those with color blindness. Thoughtful design solutions
include using color-blind friendly palettes and redundant coding (combining color with shape or
texture).
Optimizing Visual Processing Efficiency
4
Artikel van Franconeri, S. L., Padilla, L. M., Shah, P., Zacks, J. M., & Hullman, J. (2021). The
science of visual data communication: What works. Psychological Science in the Public
Interest
Introduction to Effective Data Visualization
Data visualizations serve as powerful tools for communicating complex information by leveraging the
human visual system's remarkable capacity to detect patterns and extract meaning quickly. The
article by Franconeri et al. (2021) synthesizes decades of research across psychology, cognitive
science, and information design to establish evidence-based principles for creating visualizations that
are accurate, efficient, and meaningful for diverse audiences.
At the core of effective visualization lies an understanding of how people perceive and interpret
graphical representations. Unlike textual or numerical data which requires sequential processing,
visualizations allow for parallel processing of information, enabling viewers to grasp overall trends
and outliers almost instantaneously. This advantage, however, comes with important warnings -
poorly designed visualizations can distort data, mislead interpretations, or overwhelm viewers'
cognitive capacities.
Franconeri emphasizes that visualization design must consider three fundamental aspects:
perceptual accuracy (ensuring viewers correctly decode the represented values), perceptual
efficiency (optimizing how quickly and easily information can be extracted), and conceptual
understanding (helping viewers connect visual patterns to their real-world meaning). These
principles apply across contexts from scientific publications to news media and business
communications.
The Power and Mechanisms of Visual Perception
Human visual perception excels at extracting statistical properties from visual displays. Within
fractions of a second, viewers can estimate averages, identify ranges, and spot outliers in visualized
data. This capability stems from our visual system's ability to process information in parallel across
the visual field, a stark contrast to the serial processing required for reading numbers or text.
The article presents compelling demonstrations of this phenomenon. One striking example is
Anscombe's Quartet (left side of figure 1), where four distinct datasets share identical statistical
properties (same mean, variance, and correlation) but reveal radically different patterns when
visualized. This underscores how visualizations can uncover aspects of data that summary statistics
obscure: a visualisation of data reveals more information about the data than the descriptive
statistics may reveal. An even more dramatic demonstration comes from Matejka and Fitzmaurice's
(2017) work showing nine completely different scatterplots (including one resembling a dinosaur)
that share identical statistical properties down to the second decimal place. (right side of the
picture)
1
,
Visual channels vary significantly in their effectiveness for conveying quantitative information.
Position along a common scale (as in bar charts) allows for the most precise judgments, followed by
length, area, angle, and finally color intensity. These differences in perceptual precision have
profound implications for design choices. For instance, while color may be excellent for distinguishing
categories, it performs poorly when precise quantitative comparisons are needed.
The five visual properties ranked from most to least perceptually accurate, as outlined by Franconeri
et al. (2021), are:
1. Position (e.g., on a common scale)
2. Length
3. Angle/Slope
4. Area
5. Volume/Color Saturation
Note: This hierarchy reflects human perceptual precision, with position being the most accurate for
quantitative comparisons and volume/color saturation the least.
2
,
Avoiding Perceptual Distortions and Pitfalls
One of the most common and consequential design errors involves axis truncation. When y-axes
don't start at zero, they can dramatically exaggerate perceived differences between values. The
article cites a telling example from Fox News coverage of Obamacare (see figure below alinea)
enrollment, where a truncated y-axis made the difference between 6 million and 7 million
enrollments appear three times larger than it actually was. Similar distortions appear in climate
change visualizations that use inappropriate baselines, potentially minimizing the apparent severity
of temperature increases.
Area-based visualizations present another frequent source of misinterpretation. When values are
encoded by the area of circles or squares, viewers often misjudge magnitudes because they
intuitively compare lengths or diameters rather than areas. The article addresses how this can lead to
underestimating or overestimating values by factors of two or more. This effect is particularly
problematic in bubble charts and other area-based visualizations.
Line graphs, while excellent for showing trends, introduce their own perceptual quirks. A notable
illusion occurs when comparing lines with steep slopes - the vertical distance between lines appears
to decrease as values increase, even when the actual difference remains constant. This makes it
difficult to accurately assess changes in gaps between trends over time.
3
,
Color perception introduces additional challenges. The same color can appear dramatically different
depending on its background due to contrast effects. Moreover, about 4% of the population
experiences some form of color vision deficiency, most commonly difficulty distinguishing red and
green. The article demonstrates how color-coded scatterplots that are meaningful to typical viewers
may become completely uninterpretable to those with color blindness. Thoughtful design solutions
include using color-blind friendly palettes and redundant coding (combining color with shape or
texture).
Optimizing Visual Processing Efficiency
4