1.1 SOLUTIONS 1
SOLUTION MANUAL
For
Applied Calculus 7th Edition
N
by Deborah Hughes-Hallett, Andrew M. Gleason
U
R
SE
D
O
C
S
, kjhgfdsa
CHAPTER ONE
1. (a) The story in (a) matches Graph (IV), in which the person forgot her books and had to return home.
(b) The story in (b) matches Graph (II), the flat tire story. Note the long period of time during which the distance from
home did not change (the horizontal part).
N
(c) The story in (c) matches Graph (III), in which the person started calmly but sped up later.
The first graph (I) does not match any of the given stories. In this picture, the person keeps going away from home,
but his speed decreases as time passes. So a story for this might be: I started walking to school at a good pace, but since I
stayed up all night studying calculus, I got more and more tired the farther I walked.
U
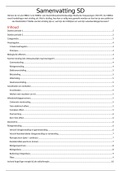
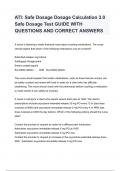
2. The height is going down as time goes on. A possible graph is shown in Figure 1.1. The graph is decreasing.
height
R
SE
D
time
Figure 1.1
O
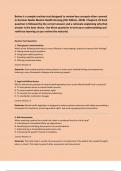
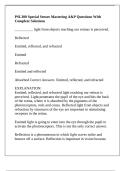
3. The amount of carbon dioxide is going up as time goes on. A possible graph is shown in Figure 1.2. The graph is increasing.
CO2
C
S
time
Figure 1.2
, 1.1 SOLUTIONS 3
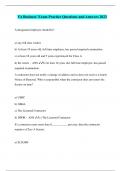
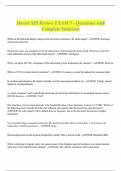
4. The number of air conditioning units sold is going up as temperature goes up. A possible graph is shown in Figure 1.3.
The graph is increasing.
AC units
N
U
temperature
Figure 1.3
R
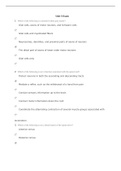
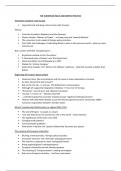
5. The noise level is going down as distance goes up. A possible graph is shown in Figure 1.4. The graph is decreasing.
SE
noise level
D
O
distance
Figure 1.4
C
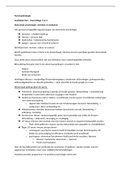
6. If we let t represent the number of years since 1900, then the population increased between t = 0 and t = 40, stayed
approximately constant between t = 40 and t = 50, and decreased for t ≥ 50. Figure 1.5 shows one possible graph. Many
S
other answers are also possible.
population
years
20 40 60 80 100 120 since 1900
Figure 1.5
, kjhgfdsa
7. Amount of grass G = f (r) increases as the amount of rainfall r increases, so f (r) is an increasing function.
8. We are given information about how atmospheric pressure P = f (ℎ) behaves when the altitude ℎ decreases: as altitude ℎ
decreases the atmospheric pressure P increases. This means that as altitude ℎ increases the atmospheric pressure P
decreases. Therefore, P = f (ℎ) is a decreasing function.
9. We are given information about how battery capacity C = f (T ) behaves when air temperature T decreases: as T decreases,
battery capacity C also decreases. This means that increasing temperature T increases battery capacity C. Therefore,
C = f (T ) is an increasing function.
10. Time T = f (m) increases as m increases, so f (m) is increasing.
11. The attendance A = f (P ) decreases as the price P increases, so f (P ) is a decreasing function.
12. The cost of manufacturing C = f (v) increases as the number of vehicles manufactured v increases, so f (v) is an increasing
N
function.
13. We are given information about how commuting time, T = f (c) behaves as the number of cars on the road c decreases:
as c decreases, commuting time T also decreases. This means that increasing the number of cars on the road c increases
commuting time T . Therefore, T = f (c) is an increasing function.
U
14. The statement f (4) = 20 tells us that W = 20 when t = 4. In other words, in 2019, Argentina produced 20 million metric
tons of wheat.
15. (a) If we consider the equation
C = 4T − 160
R
simply as a mathematical relationship between two variables C and T , any T value is possible. However, if we think
of it as a relationship between cricket chirps and temperature, then C cannot be less than 0. Since C = 0 leads to
0 = 4T − 160, and so T = 40 F, we see that T cannot be less than 40 F. In addition, we are told that the function is
SE
not defined for temperatures above 134 . Thus, for the function C = f (T ) we have
Domain = All T values between 40 F and 134 F
= All T values with 40 ≤ T ≤ 134
= [40, 134].
(b) Again, if we consider C = 4T − 160 simply as a mathematical relationship, its range is all real C values. However,
D
when thinking of the meaning of C = f (T ) for crickets, we see that the function predicts cricket chirps per minute
between 0 (at T = 40 F) and 376 (at T = 134 F). Hence,
Range = All C values from 0 to 376
O
= All C values with 0 ≤ C ≤ 376
= [0, 376].
C
16. (a) The statement f (19) = 415 means that C = 415 when t = 19. In other words, in the year 2019, the concentration of
carbon dioxide in the atmosphere was 415 ppm.
(b) The expression f (22) represents the concentration of carbon dioxide in the year 2022.
17. (a) At p = 0, we see r = 8. At p = 3, we see r = 7.
S
(b) When p = 2, we see r = 10. Thus, f (2) = 10.
18. Substituting x = 5 into f (x) = 2x + 3 gives
f (5) = 2(5) + 3 = 10 + 3 = 13.
19. Substituting x = 5 into f (x) = 10x − x2 gives
f (5) = 10(5) − (5)2 = 50 − 25 = 25.
20. We want the y-coordinate of the graph at the point where its x-coordinate is 5. Looking at the graph, we see that the
y-coordinate of this point is 3. Thus
f (5) = 3.
SOLUTION MANUAL
For
Applied Calculus 7th Edition
N
by Deborah Hughes-Hallett, Andrew M. Gleason
U
R
SE
D
O
C
S
, kjhgfdsa
CHAPTER ONE
1. (a) The story in (a) matches Graph (IV), in which the person forgot her books and had to return home.
(b) The story in (b) matches Graph (II), the flat tire story. Note the long period of time during which the distance from
home did not change (the horizontal part).
N
(c) The story in (c) matches Graph (III), in which the person started calmly but sped up later.
The first graph (I) does not match any of the given stories. In this picture, the person keeps going away from home,
but his speed decreases as time passes. So a story for this might be: I started walking to school at a good pace, but since I
stayed up all night studying calculus, I got more and more tired the farther I walked.
U
2. The height is going down as time goes on. A possible graph is shown in Figure 1.1. The graph is decreasing.
height
R
SE
D
time
Figure 1.1
O
3. The amount of carbon dioxide is going up as time goes on. A possible graph is shown in Figure 1.2. The graph is increasing.
CO2
C
S
time
Figure 1.2
, 1.1 SOLUTIONS 3
4. The number of air conditioning units sold is going up as temperature goes up. A possible graph is shown in Figure 1.3.
The graph is increasing.
AC units
N
U
temperature
Figure 1.3
R
5. The noise level is going down as distance goes up. A possible graph is shown in Figure 1.4. The graph is decreasing.
SE
noise level
D
O
distance
Figure 1.4
C
6. If we let t represent the number of years since 1900, then the population increased between t = 0 and t = 40, stayed
approximately constant between t = 40 and t = 50, and decreased for t ≥ 50. Figure 1.5 shows one possible graph. Many
S
other answers are also possible.
population
years
20 40 60 80 100 120 since 1900
Figure 1.5
, kjhgfdsa
7. Amount of grass G = f (r) increases as the amount of rainfall r increases, so f (r) is an increasing function.
8. We are given information about how atmospheric pressure P = f (ℎ) behaves when the altitude ℎ decreases: as altitude ℎ
decreases the atmospheric pressure P increases. This means that as altitude ℎ increases the atmospheric pressure P
decreases. Therefore, P = f (ℎ) is a decreasing function.
9. We are given information about how battery capacity C = f (T ) behaves when air temperature T decreases: as T decreases,
battery capacity C also decreases. This means that increasing temperature T increases battery capacity C. Therefore,
C = f (T ) is an increasing function.
10. Time T = f (m) increases as m increases, so f (m) is increasing.
11. The attendance A = f (P ) decreases as the price P increases, so f (P ) is a decreasing function.
12. The cost of manufacturing C = f (v) increases as the number of vehicles manufactured v increases, so f (v) is an increasing
N
function.
13. We are given information about how commuting time, T = f (c) behaves as the number of cars on the road c decreases:
as c decreases, commuting time T also decreases. This means that increasing the number of cars on the road c increases
commuting time T . Therefore, T = f (c) is an increasing function.
U
14. The statement f (4) = 20 tells us that W = 20 when t = 4. In other words, in 2019, Argentina produced 20 million metric
tons of wheat.
15. (a) If we consider the equation
C = 4T − 160
R
simply as a mathematical relationship between two variables C and T , any T value is possible. However, if we think
of it as a relationship between cricket chirps and temperature, then C cannot be less than 0. Since C = 0 leads to
0 = 4T − 160, and so T = 40 F, we see that T cannot be less than 40 F. In addition, we are told that the function is
SE
not defined for temperatures above 134 . Thus, for the function C = f (T ) we have
Domain = All T values between 40 F and 134 F
= All T values with 40 ≤ T ≤ 134
= [40, 134].
(b) Again, if we consider C = 4T − 160 simply as a mathematical relationship, its range is all real C values. However,
D
when thinking of the meaning of C = f (T ) for crickets, we see that the function predicts cricket chirps per minute
between 0 (at T = 40 F) and 376 (at T = 134 F). Hence,
Range = All C values from 0 to 376
O
= All C values with 0 ≤ C ≤ 376
= [0, 376].
C
16. (a) The statement f (19) = 415 means that C = 415 when t = 19. In other words, in the year 2019, the concentration of
carbon dioxide in the atmosphere was 415 ppm.
(b) The expression f (22) represents the concentration of carbon dioxide in the year 2022.
17. (a) At p = 0, we see r = 8. At p = 3, we see r = 7.
S
(b) When p = 2, we see r = 10. Thus, f (2) = 10.
18. Substituting x = 5 into f (x) = 2x + 3 gives
f (5) = 2(5) + 3 = 10 + 3 = 13.
19. Substituting x = 5 into f (x) = 10x − x2 gives
f (5) = 10(5) − (5)2 = 50 − 25 = 25.
20. We want the y-coordinate of the graph at the point where its x-coordinate is 5. Looking at the graph, we see that the
y-coordinate of this point is 3. Thus
f (5) = 3.