REAL ESTATE FINANCE AND ECONOMICS -
2025
Table of contents
Lecture 1: Introduction............................................................................................................................................................2
1.1 Why study real estate?.................................................................................................................................................2
1.2 Stylized facts..................................................................................................................................................................4
1.3 How to measure the evolution of house prices?..........................................................................................................7
Lecture 2: House price models..............................................................................................................................................10
2.1 Introduction................................................................................................................................................................10
2.2 Housing Supply............................................................................................................................................................11
2.3 Simple “user cost” model............................................................................................................................................12
2.4 Ability to pay model....................................................................................................................................................13
2.5 Four-quadrant model..................................................................................................................................................14
Lecture 3: Models (contr.) & Policy.......................................................................................................................................16
3.1 Monocentric city model..............................................................................................................................................16
3.2 Policy: stimulating homeownership............................................................................................................................18
Lecture 4: Valuation..............................................................................................................................................................21
4.1 Valuation.....................................................................................................................................................................21
4.2 Relationship between changing market conditions, cap rates and property values.................................................28
4.3 Cost approach.............................................................................................................................................................29
Lecture 6: Investments..........................................................................................................................................................30
6.1 Introduction................................................................................................................................................................30
6.2 How does the level of debt affect the IRR?................................................................................................................34
Lecture 7: Investments..........................................................................................................................................................37
7.1 Investments in climate change mitigation..................................................................................................................37
7.2 Real options.................................................................................................................................................................38
Lecture 8: Supply...................................................................................................................................................................41
8.1 Introduction................................................................................................................................................................41
8.2 Questions to answer...................................................................................................................................................44
8.3 Broader effects of limiting housing supply.................................................................................................................47
8.4 Mandatory reading.....................................................................................................................................................48
1
,Lecture 1: Introduction
Course content:
Learning objectives:
- Why care about real estate?
- Know stylized facts about house price evolutions and total returns to housing
- Understand different methodologies to measure house price evolutions
1.1 WHY STUDY REAL ESTATE?
1. Real estate is by far the most significant store of wealth
a. Real estate = most important asset, most residential
b. Everyone will make financial decisions, 1/5 belgian make decisions for mortgage (buy/rent)
2. Homeownership is dominant tenure type in many countries
2
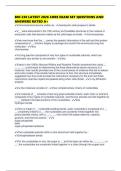
,3. Houses are THE asset of the bottom 90%
a. Left: housing is bottom 50%: not a lot stocks, a lot debt: take out mortgage to finance house
average net equity positive but smaller then 50-90% graph: cash or bonds, higher equity position: in
stocks + bonds
b. Left under: top 10% richest people: housing and own more stocks and companies: business people,
housing debt very small part, more diversified then others
4. Wealth growth from asset price
a. Before financial crisis: wealth grew more 10%: bottom 50% own housing & able to benefit from it
b. After crisis: prices dropped: decreasing prices, oversupply: most hit bottom 50% wealth decreased
significantly in contrast to top 10% their wealth increasing
c. Wealth different groups changed over time (photo: left side more green, everyone has garden, rich
part of city -> other side: poor)
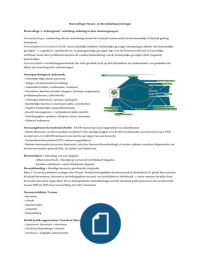
5. Housing IS the business cyle
a. = able to predict moving business cycle
3
, b. Graph US:
11 recessions 9 were downturn of housing investment: black line: innovation of construction)
if decrease in construction then less recession and vice versa
2 false positives = decrease but no recession: 50s and FP increase defence spending
2 false negatives = recession but increase? Before FP: war and 2001: recession due decrease
consumption of internet bubble crashed
6. Interest rates affect housing starts
a. Decrease interest rate -> increase number sales
b. Increase -> decrease number sales
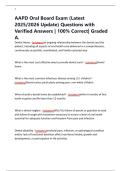
7. Climate change
a. Belgium (Ardennes): people not believe they go live in those regions (floating) so affected house prices
and important issues
b. Float map: illustration of identifying properties in flood zone (outdated map)
1.2 STYLIZED FACTS
- House prices in long run
o Horizontal: prices increase at same rate as inflation (increase so do inflation)
o Pattern: kind of hockey stick = when house prices start to increase significantly before they were flat
o Events can have impact: war, Belgium purchase in 80 same in 60s so prices stayed constant
o Increase is not as strong in the US then in Belgium
4
2025
Table of contents
Lecture 1: Introduction............................................................................................................................................................2
1.1 Why study real estate?.................................................................................................................................................2
1.2 Stylized facts..................................................................................................................................................................4
1.3 How to measure the evolution of house prices?..........................................................................................................7
Lecture 2: House price models..............................................................................................................................................10
2.1 Introduction................................................................................................................................................................10
2.2 Housing Supply............................................................................................................................................................11
2.3 Simple “user cost” model............................................................................................................................................12
2.4 Ability to pay model....................................................................................................................................................13
2.5 Four-quadrant model..................................................................................................................................................14
Lecture 3: Models (contr.) & Policy.......................................................................................................................................16
3.1 Monocentric city model..............................................................................................................................................16
3.2 Policy: stimulating homeownership............................................................................................................................18
Lecture 4: Valuation..............................................................................................................................................................21
4.1 Valuation.....................................................................................................................................................................21
4.2 Relationship between changing market conditions, cap rates and property values.................................................28
4.3 Cost approach.............................................................................................................................................................29
Lecture 6: Investments..........................................................................................................................................................30
6.1 Introduction................................................................................................................................................................30
6.2 How does the level of debt affect the IRR?................................................................................................................34
Lecture 7: Investments..........................................................................................................................................................37
7.1 Investments in climate change mitigation..................................................................................................................37
7.2 Real options.................................................................................................................................................................38
Lecture 8: Supply...................................................................................................................................................................41
8.1 Introduction................................................................................................................................................................41
8.2 Questions to answer...................................................................................................................................................44
8.3 Broader effects of limiting housing supply.................................................................................................................47
8.4 Mandatory reading.....................................................................................................................................................48
1
,Lecture 1: Introduction
Course content:
Learning objectives:
- Why care about real estate?
- Know stylized facts about house price evolutions and total returns to housing
- Understand different methodologies to measure house price evolutions
1.1 WHY STUDY REAL ESTATE?
1. Real estate is by far the most significant store of wealth
a. Real estate = most important asset, most residential
b. Everyone will make financial decisions, 1/5 belgian make decisions for mortgage (buy/rent)
2. Homeownership is dominant tenure type in many countries
2
,3. Houses are THE asset of the bottom 90%
a. Left: housing is bottom 50%: not a lot stocks, a lot debt: take out mortgage to finance house
average net equity positive but smaller then 50-90% graph: cash or bonds, higher equity position: in
stocks + bonds
b. Left under: top 10% richest people: housing and own more stocks and companies: business people,
housing debt very small part, more diversified then others
4. Wealth growth from asset price
a. Before financial crisis: wealth grew more 10%: bottom 50% own housing & able to benefit from it
b. After crisis: prices dropped: decreasing prices, oversupply: most hit bottom 50% wealth decreased
significantly in contrast to top 10% their wealth increasing
c. Wealth different groups changed over time (photo: left side more green, everyone has garden, rich
part of city -> other side: poor)
5. Housing IS the business cyle
a. = able to predict moving business cycle
3
, b. Graph US:
11 recessions 9 were downturn of housing investment: black line: innovation of construction)
if decrease in construction then less recession and vice versa
2 false positives = decrease but no recession: 50s and FP increase defence spending
2 false negatives = recession but increase? Before FP: war and 2001: recession due decrease
consumption of internet bubble crashed
6. Interest rates affect housing starts
a. Decrease interest rate -> increase number sales
b. Increase -> decrease number sales
7. Climate change
a. Belgium (Ardennes): people not believe they go live in those regions (floating) so affected house prices
and important issues
b. Float map: illustration of identifying properties in flood zone (outdated map)
1.2 STYLIZED FACTS
- House prices in long run
o Horizontal: prices increase at same rate as inflation (increase so do inflation)
o Pattern: kind of hockey stick = when house prices start to increase significantly before they were flat
o Events can have impact: war, Belgium purchase in 80 same in 60s so prices stayed constant
o Increase is not as strong in the US then in Belgium
4