DIGITAL METHODS
1. Introduction digital methods
1.1. Digital methods: close reading, distant reading and common
characteristics of big data
1.1.1. Situating the course
“The best way to create this powerful hybrid is not to focus on abstract
social theory or fancy machine learning. The best place to start is research
design. If you think of social research as the process of asking and
answering questions about human behavior, then research design is the
connective tissue; research design links questions and answers (Salganik,
2017 p.6).”
1.1.2. Close reading (qualitative)
- Offline-online continuum
- Danah Boyd making sense of teen life
Research approach
1. Immersion in teen pop culture and subculture
2. Participant observation and content analysis of traces on social
media
3. Deep hanging out in physical spaces
4. Semi structured face-to-face interviews
- social media certainly make it much easier to peek into people’s lives, but
it is also quite easy to misinterpret online traces
- Example: Gang insignia on MySpace profile indication of Gang
involvement?
Alternative explanation:
“Without knowing the specific boy involved, I surmised that he was probably
focused on fitting in, staying safe, or, more directly, surviving in his home
environment. Most likely he felt as though he needed to perform gang affiliation
online—especially if he was not affiliated—in order to make certain that he was
not physically vulnerable.’
Importance of close reading: interpretation based on detailed analysis
Lecture 9: Digital Ethnography I & II
Lecture 10: Walkthrough, going-along and scrolling back
Lecture 11: Understanding Everyday Life in Digitizing Societies: Interviewing,
Observing, and Going-Along
1.1.3. Distant reading (quantitative)
- “Big Data”: Advances in technology & analysis
o About computational power, identifying patterns, etc.
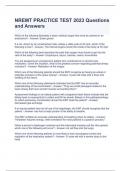
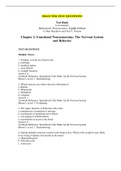
- Example: Investigating health and wealth in Rwanda
o Traditional social science survey
o Call records (of approx. 1,5 million people)
Importance of distant reading: analyzing large numbers of data(sets)
1
,DIGITAL METHODS
A picture says more than a thousand words. This kind of research is distant
research combining data
Lecture 2: Big data in your pocket: Benefits, drawbacks, and procedures of
using smartphone log data
Lecture 3: Computational Social Science and Open Science: Incorporating
'algorithmic thinking' into everyday research practice
Lecture 4: Data Viz: Principles of visualizing data
Lecture 5: Collecting data from the web
Lecture 6: Digital trace data, Intensive Longitudinal modelling, predictive
modeling and machine learning
Lecture 7: What is true for ‘the average person’ may not be true for you!
The rise of the person-specific paradigm
Lecture 8: Exploring Experiences in VR: From Numbers To Narratives
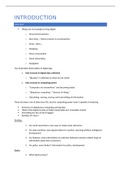
1.1.4. Readymade versus custom-made data
2
,DIGITAL METHODS
Dushamps en Michelangelo --- Metafoor met verschillende soorten data
1.1.5. 10 characteristics of Big Data sources
- Digital traces Big Data Digital methods
o Generally helpful for research: big, always-on, and nonreactive
o Generally problematic for research: incomplete, inaccessible,
nonrepresentative, drifting, algorithmically cofounded, dirty, and
sensitive
Data biases
- Just focuses on what is out there don‘t nessecary tells something abt the
meaning
Big data:
- Repurposing
o ‘Found’ versus ‘designed’ data
Found data: data that are being found by researchers
Designed data: specifically designed to study that purpose
- What should the ideal data set look like?
- ‘Twitter’ versus ‘social survey’ data
1. Big:
o Is all that data really doing anything?
o Big datasets are never an end in themselves, but do allow for the
study of rare cases, detection small differences, and estimation of
heterogeneity
It’s not bcs you have a larger dataset that it’s automatically
better data
The bigger your dataset the more you can focus on small
details that you less able to do in a smaller dataset
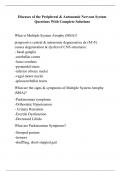
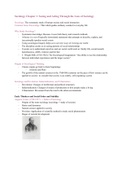
o Analysis of the 2016 US Presidential Campaign on Twitter (Kollanyi,
Howard, Woolley, 2016)
3
, DIGITAL METHODS
Total of 18 910 250 tweets were analyzed
o 39.1% debat tweets pro Trump hashtag (e.g., #MAGA)
o 13.6% debat tweets pro Clinton (e.g., #ImWithHer)
However…
o 32.7% pro tweets Trump originated from bots
o 22.3% pro tweets Clinton originated from bots
2. Always-on
o Unexpected events
o Real-time measurements
o Example: Sandy-related Twitter and Foursquare data
3. Nonreactive
o Measurement in big data sources is much less likely to change
behavior
o However, social desirability bias can still be present
4. Incomplete
o Usually the following information is missing/incomplete
Demographic information about participants
Behavior on other platforms
Data to operationalize theoretical constructs
o Construct validity (match between the data and the thing you are
trying to measure)
E.g. spending more time on the phone with your colleague
does not simply imply that they are more important than
spouses.
o Measuring social capital
Articulated networks – contacts
Behavioral networks – communication
o Construct validity?
For example: spending more time on the phone with your
colleague does not imply that they are more important that
spouses.
5. Inaccessible
o Data held by companies and government are difficult for researchers
to access
o Example:
FB reportedly provided inaccurate data to misinformation
researchers
Twitter ends its free API: Here’s who will be affected
6. Nonrepresentative
o Nonrepresentative data are bad for out-of-sample generalizations,
but can be quite useful for within-sample comparisons
7. Drifting
o “if you want to measure change, don’t change the measure”
Population drift – people flowing from one platform to another
(fe. Older generations now on FB)
4
1. Introduction digital methods
1.1. Digital methods: close reading, distant reading and common
characteristics of big data
1.1.1. Situating the course
“The best way to create this powerful hybrid is not to focus on abstract
social theory or fancy machine learning. The best place to start is research
design. If you think of social research as the process of asking and
answering questions about human behavior, then research design is the
connective tissue; research design links questions and answers (Salganik,
2017 p.6).”
1.1.2. Close reading (qualitative)
- Offline-online continuum
- Danah Boyd making sense of teen life
Research approach
1. Immersion in teen pop culture and subculture
2. Participant observation and content analysis of traces on social
media
3. Deep hanging out in physical spaces
4. Semi structured face-to-face interviews
- social media certainly make it much easier to peek into people’s lives, but
it is also quite easy to misinterpret online traces
- Example: Gang insignia on MySpace profile indication of Gang
involvement?
Alternative explanation:
“Without knowing the specific boy involved, I surmised that he was probably
focused on fitting in, staying safe, or, more directly, surviving in his home
environment. Most likely he felt as though he needed to perform gang affiliation
online—especially if he was not affiliated—in order to make certain that he was
not physically vulnerable.’
Importance of close reading: interpretation based on detailed analysis
Lecture 9: Digital Ethnography I & II
Lecture 10: Walkthrough, going-along and scrolling back
Lecture 11: Understanding Everyday Life in Digitizing Societies: Interviewing,
Observing, and Going-Along
1.1.3. Distant reading (quantitative)
- “Big Data”: Advances in technology & analysis
o About computational power, identifying patterns, etc.
- Example: Investigating health and wealth in Rwanda
o Traditional social science survey
o Call records (of approx. 1,5 million people)
Importance of distant reading: analyzing large numbers of data(sets)
1
,DIGITAL METHODS
A picture says more than a thousand words. This kind of research is distant
research combining data
Lecture 2: Big data in your pocket: Benefits, drawbacks, and procedures of
using smartphone log data
Lecture 3: Computational Social Science and Open Science: Incorporating
'algorithmic thinking' into everyday research practice
Lecture 4: Data Viz: Principles of visualizing data
Lecture 5: Collecting data from the web
Lecture 6: Digital trace data, Intensive Longitudinal modelling, predictive
modeling and machine learning
Lecture 7: What is true for ‘the average person’ may not be true for you!
The rise of the person-specific paradigm
Lecture 8: Exploring Experiences in VR: From Numbers To Narratives
1.1.4. Readymade versus custom-made data
2
,DIGITAL METHODS
Dushamps en Michelangelo --- Metafoor met verschillende soorten data
1.1.5. 10 characteristics of Big Data sources
- Digital traces Big Data Digital methods
o Generally helpful for research: big, always-on, and nonreactive
o Generally problematic for research: incomplete, inaccessible,
nonrepresentative, drifting, algorithmically cofounded, dirty, and
sensitive
Data biases
- Just focuses on what is out there don‘t nessecary tells something abt the
meaning
Big data:
- Repurposing
o ‘Found’ versus ‘designed’ data
Found data: data that are being found by researchers
Designed data: specifically designed to study that purpose
- What should the ideal data set look like?
- ‘Twitter’ versus ‘social survey’ data
1. Big:
o Is all that data really doing anything?
o Big datasets are never an end in themselves, but do allow for the
study of rare cases, detection small differences, and estimation of
heterogeneity
It’s not bcs you have a larger dataset that it’s automatically
better data
The bigger your dataset the more you can focus on small
details that you less able to do in a smaller dataset
o Analysis of the 2016 US Presidential Campaign on Twitter (Kollanyi,
Howard, Woolley, 2016)
3
, DIGITAL METHODS
Total of 18 910 250 tweets were analyzed
o 39.1% debat tweets pro Trump hashtag (e.g., #MAGA)
o 13.6% debat tweets pro Clinton (e.g., #ImWithHer)
However…
o 32.7% pro tweets Trump originated from bots
o 22.3% pro tweets Clinton originated from bots
2. Always-on
o Unexpected events
o Real-time measurements
o Example: Sandy-related Twitter and Foursquare data
3. Nonreactive
o Measurement in big data sources is much less likely to change
behavior
o However, social desirability bias can still be present
4. Incomplete
o Usually the following information is missing/incomplete
Demographic information about participants
Behavior on other platforms
Data to operationalize theoretical constructs
o Construct validity (match between the data and the thing you are
trying to measure)
E.g. spending more time on the phone with your colleague
does not simply imply that they are more important than
spouses.
o Measuring social capital
Articulated networks – contacts
Behavioral networks – communication
o Construct validity?
For example: spending more time on the phone with your
colleague does not imply that they are more important that
spouses.
5. Inaccessible
o Data held by companies and government are difficult for researchers
to access
o Example:
FB reportedly provided inaccurate data to misinformation
researchers
Twitter ends its free API: Here’s who will be affected
6. Nonrepresentative
o Nonrepresentative data are bad for out-of-sample generalizations,
but can be quite useful for within-sample comparisons
7. Drifting
o “if you want to measure change, don’t change the measure”
Population drift – people flowing from one platform to another
(fe. Older generations now on FB)
4