BSIS EXAM 3
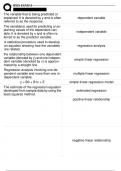
The variable that is being predicted or
explained. It is denoted by y and is often dependent variable
referred to as the response.
The variable(s) used for predicting or ex-
plaining values of the dependent vari-
independent variable
able. It is denoted by x and is often re-
ferred to as the predictor variable.
A statistical procedure used to develop
an equation showing how the variables regression analysis
are related.
the relationship between one dependent
variable (denoted by y) and one indepen-
simple linear regression
dent variable (denoted by x) is approxi-
mated by a straight line
Regression analysis involving one de-
pendent variable and more than one in- multiple linear regression
dependent variable.
y = B0 + B1x + E simple linear regression model
The estimate of the regression equation
developed from sample data by using the estimated regression
least squares method.
positive linear relationship
negative linear relationship
1/8
, BSIS EXAM 3
no relationship
A single value used as an estimate of the
point estimator
corresponding population parameter.
A procedure for using sample data to find
least squares method
the estimated regression equation.
The difference between the observed
value of the dependent variable and the
residual
value predicted using the estimated re-
gression equation
the range of values of the independent
variables in the data used to estimate the experimental region
model
Prediction of the mean value of the de-
pendent variable y for values of the in-
extrapolation
dependent variables that are outside the
experimental range.
Step 1: Right-click on any data point in
the scatter chart and select Add Trend-
line Using Excel's Chart Tools to Compute
Step 2: When the Format Trendline task the Estimated Regression Equation
pane appears: Select Linear in the Trend-
line Options area, then Select Display
2/8
The variable that is being predicted or
explained. It is denoted by y and is often dependent variable
referred to as the response.
The variable(s) used for predicting or ex-
plaining values of the dependent vari-
independent variable
able. It is denoted by x and is often re-
ferred to as the predictor variable.
A statistical procedure used to develop
an equation showing how the variables regression analysis
are related.
the relationship between one dependent
variable (denoted by y) and one indepen-
simple linear regression
dent variable (denoted by x) is approxi-
mated by a straight line
Regression analysis involving one de-
pendent variable and more than one in- multiple linear regression
dependent variable.
y = B0 + B1x + E simple linear regression model
The estimate of the regression equation
developed from sample data by using the estimated regression
least squares method.
positive linear relationship
negative linear relationship
1/8
, BSIS EXAM 3
no relationship
A single value used as an estimate of the
point estimator
corresponding population parameter.
A procedure for using sample data to find
least squares method
the estimated regression equation.
The difference between the observed
value of the dependent variable and the
residual
value predicted using the estimated re-
gression equation
the range of values of the independent
variables in the data used to estimate the experimental region
model
Prediction of the mean value of the de-
pendent variable y for values of the in-
extrapolation
dependent variables that are outside the
experimental range.
Step 1: Right-click on any data point in
the scatter chart and select Add Trend-
line Using Excel's Chart Tools to Compute
Step 2: When the Format Trendline task the Estimated Regression Equation
pane appears: Select Linear in the Trend-
line Options area, then Select Display
2/8