Lab Assignment 3 Copyright © Wan Wang
11PSYC 2260 Assignment 3
Due Date: March 1 (Friday), 2024 at 11:59 PM on UM Learn.
Total Marks: 40
Purpose: In this assignment, you will practice creating graphs with error bars, perform hand calculations, and
conduct hypothesis testing. You will also perform power analysis using G*Power to estimate sample size.
There are 4 big questions and multiple sub-questions under each.
*********************INSTRUCTIONS (Read Carefully)*************************************
1. SAVE your assignment as a PDF file before submission. To do so, Click File, Save As, and choose the
location, then click the drop down menu beside “Save as type” and select PDF.
2. Submit your PDF format assignment via UM Learn assignment submission folder. Make sure to save
the submission email sent to you as a proof. Note that only the most recent submitted copy will be saved
and graded.
3. You can keep the question wordings in this document and type your response in blue color
underneath each question or into the table for filling out the cells.
4. For questions that specify to “show calculation”, show one step of calculation by plugging in or
writing out the scores according to the appropriate formula, in addition to providing the result (round
to two decimal places if there are infinite decimal places.
*********************INSTRUCTIONS (Read Carefully)*************************************
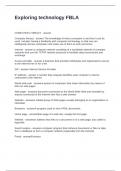
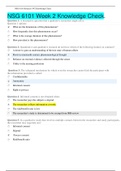
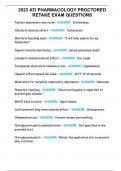
Q1. Create Bar Graphs with Error Bars for Standard Error of M (SE).
A study on the effect of mental time travel on feelings of hope found that participants who imagined a future
desirable event felt more hopeful than participants who recalled a past desirable event. The mean, standard
deviation, and standard errors for the two groups (i.e., two distributions) are displayed in the APA style table
below:
Mean SD SE
Imagine Future 7.00 1.89 0.93
Recall Past 4.25 1.47 0.36
Follow instructions in the Lab 3 Tutorial to create a bar graph for this data and display the standard errors in
error bars. Copy and paste the graph below [7 marks].
1
0.8
0.6
Hopeful
0.4
0.2
0
Imagine Future Recall Past
Mental Time Travel
, Lab Assignment 3 Copyright © Wan Wang
Q2. Hypothesis Testing with z Test (two-tailed).
Suppose we think that listening to classical music will affect the amount of time it takes a person to fall
asleep. We conducted a study to test this idea. Assume that the amount of time it takes people in the
population to fall asleep is normally distributed.
A. In the study, we asked participants (n = 90) to listen to classical music and then we measured how long it
took them to fall asleep. The mean time that they fell asleep was in 14 minutes. Suppose that the average
person in the population falls asleep in 20 minutes (without listening to classical music) with σ = 9 min, state
the null and alternative hypotheses for this study for a two-tailed test. [2 marks]
Null hypothesis using symbol: ( H o ): μ=20
Alternative hypothesis using symbol: ( H A ): μ≠20
Null hypothesis in words: The mean time it takes for people to fall asleep after listening to classical music is
the same as the general population (20 minutes).
Alternative hypothesis in words: The mean time it takes for people to fall asleep after listening to classical
music is different from the general population (not equal to 20 minutes).
B. Using a significance level α = .05 with a two-tailed test. What are the critical values? [1 marks]
The critical values for a two-tailed test at α = 0.05 are ±1.96.
C. Calculate the test statistic: Show the formula, at least one step of calculation, and the obtained result.
Round to two decimal places. [2 marks]
X−μ
z=
σ /√ n
X=14
μ=20
σ=9
n=90
14−20
z=
9 /√ 90
−6
z=
0.948
z = -6.33
D. Using your answer to Q2.B and Q2.C, explain whether you reject or fail to reject the null hypothesis and
why. [1 mark]
From Q2.B, the critical values are ±1.96.
From Q2.C, the obtained z-score is –6.33, which is far beyond –1.96.
Since –6.33 is in the rejection region, I reject the null hypothesis.
There is sufficient evidence to suggest that listening to classical music significantly affects how long it takes a
person to fall asleep.
11PSYC 2260 Assignment 3
Due Date: March 1 (Friday), 2024 at 11:59 PM on UM Learn.
Total Marks: 40
Purpose: In this assignment, you will practice creating graphs with error bars, perform hand calculations, and
conduct hypothesis testing. You will also perform power analysis using G*Power to estimate sample size.
There are 4 big questions and multiple sub-questions under each.
*********************INSTRUCTIONS (Read Carefully)*************************************
1. SAVE your assignment as a PDF file before submission. To do so, Click File, Save As, and choose the
location, then click the drop down menu beside “Save as type” and select PDF.
2. Submit your PDF format assignment via UM Learn assignment submission folder. Make sure to save
the submission email sent to you as a proof. Note that only the most recent submitted copy will be saved
and graded.
3. You can keep the question wordings in this document and type your response in blue color
underneath each question or into the table for filling out the cells.
4. For questions that specify to “show calculation”, show one step of calculation by plugging in or
writing out the scores according to the appropriate formula, in addition to providing the result (round
to two decimal places if there are infinite decimal places.
*********************INSTRUCTIONS (Read Carefully)*************************************
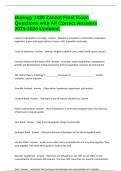
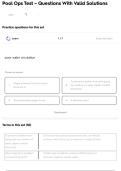
Q1. Create Bar Graphs with Error Bars for Standard Error of M (SE).
A study on the effect of mental time travel on feelings of hope found that participants who imagined a future
desirable event felt more hopeful than participants who recalled a past desirable event. The mean, standard
deviation, and standard errors for the two groups (i.e., two distributions) are displayed in the APA style table
below:
Mean SD SE
Imagine Future 7.00 1.89 0.93
Recall Past 4.25 1.47 0.36
Follow instructions in the Lab 3 Tutorial to create a bar graph for this data and display the standard errors in
error bars. Copy and paste the graph below [7 marks].
1
0.8
0.6
Hopeful
0.4
0.2
0
Imagine Future Recall Past
Mental Time Travel
, Lab Assignment 3 Copyright © Wan Wang
Q2. Hypothesis Testing with z Test (two-tailed).
Suppose we think that listening to classical music will affect the amount of time it takes a person to fall
asleep. We conducted a study to test this idea. Assume that the amount of time it takes people in the
population to fall asleep is normally distributed.
A. In the study, we asked participants (n = 90) to listen to classical music and then we measured how long it
took them to fall asleep. The mean time that they fell asleep was in 14 minutes. Suppose that the average
person in the population falls asleep in 20 minutes (without listening to classical music) with σ = 9 min, state
the null and alternative hypotheses for this study for a two-tailed test. [2 marks]
Null hypothesis using symbol: ( H o ): μ=20
Alternative hypothesis using symbol: ( H A ): μ≠20
Null hypothesis in words: The mean time it takes for people to fall asleep after listening to classical music is
the same as the general population (20 minutes).
Alternative hypothesis in words: The mean time it takes for people to fall asleep after listening to classical
music is different from the general population (not equal to 20 minutes).
B. Using a significance level α = .05 with a two-tailed test. What are the critical values? [1 marks]
The critical values for a two-tailed test at α = 0.05 are ±1.96.
C. Calculate the test statistic: Show the formula, at least one step of calculation, and the obtained result.
Round to two decimal places. [2 marks]
X−μ
z=
σ /√ n
X=14
μ=20
σ=9
n=90
14−20
z=
9 /√ 90
−6
z=
0.948
z = -6.33
D. Using your answer to Q2.B and Q2.C, explain whether you reject or fail to reject the null hypothesis and
why. [1 mark]
From Q2.B, the critical values are ±1.96.
From Q2.C, the obtained z-score is –6.33, which is far beyond –1.96.
Since –6.33 is in the rejection region, I reject the null hypothesis.
There is sufficient evidence to suggest that listening to classical music significantly affects how long it takes a
person to fall asleep.