Contents
2. Some principles in population genetics..................................................................................................... 3
2.1 Mendelian inheritance........................................................................................................................ 3
2.2 The biometrical school........................................................................................................................ 3
Mendel vs biometrical school............................................................................................................... 3
2.3 Hardy-Weinberg’s law......................................................................................................................... 4
Usage of Hardy-Weinberg..................................................................................................................... 5
2.4 The statistical nature of quantitative inheritance................................................................................ 5
Proved by: ‘Central limit theorema’/law of large numbers...................................................................5
2.5 The number of possible genotypes..................................................................................................... 5
3. Factors affecting allele frequencies........................................................................................................... 7
3.1 Intoduction......................................................................................................................................... 7
3.2 Mutation............................................................................................................................................. 7
3.2.1 Single mutation............................................................................................................................ 7
3.2.2 Repetitive mutation..................................................................................................................... 7
3.2.3 frequency: repetitive & reverse mutation.................................................................................... 7
3.2.4 Number of mutations................................................................................................................... 8
3.3 Migration............................................................................................................................................ 8
3.4 Selection (and fitness)......................................................................................................................... 8
3.4.1 Selective disadvantage of an allele a............................................................................................ 9
3.4.2 Overvieuw all cases of dominance: calculation of genefrequency after selection........................9
3.4.3 selection: number of generations needed.................................................................................. 11
Equilibrium between mutation and selection.....................................................................................12
3.5 Genetic drift...................................................................................................................................... 12
3.5.1 drift: result of chance/coincidence............................................................................................. 12
3.5.2 genetic drift and micro-evolution............................................................................................... 13
3.5.3 factors that increase genetic drift:.............................................................................................. 13
3.5.4 The ideal population of Wright-Fisher........................................................................................ 13
3.5.5 Effective size Ne......................................................................................................................... 13
4. genetic variance...................................................................................................................................... 15
4.1 One locus model............................................................................................................................... 15
4.1.1 the effect of a gene (allele)......................................................................................................... 15
4.1.2 Breeding value in the one locus model....................................................................................... 16
4.2 two loci model.................................................................................................................................. 17
5. genetic relatedness................................................................................................................................. 18
5.1 Genetic relationship between individuals......................................................................................... 18
5.1.1 Sampling process during reproduction....................................................................................... 18
5.2 The identity of genes......................................................................................................................... 18
1
, 1 Coancestry coefficient...................................................................................................................... 18
2 additive genetic relationship coefficient........................................................................................... 18
3 The degree of relationship............................................................................................................... 19
4 The inbreeding coefficient................................................................................................................ 19
5.3 calculating the identity of genes........................................................................................................ 19
6. Inbreeding............................................................................................................................................... 21
6.1 Reduced performance....................................................................................................................... 21
6.2 compensate for inbreeding: mass selection...................................................................................... 22
6.3 Effective population size and the rate of inbreeding.........................................................................22
Rate of inbreeding............................................................................................................................... 22
6.4 inbreeding and depression: examples............................................................................................... 22
6.5 Genetic purging................................................................................................................................. 23
6.6 Inbred lines: inbreeding and genetic variance................................................................................... 23
1.7 conclusion..................................................................................................................................... 23
7. Crossbreeding (part A) – Crossing and the effect of crossing..................................................................25
7.1 reasons/effects of crossings.............................................................................................................. 25
7.2 Additive breed effect of crossbred.................................................................................................... 25
7.3 The F1 generation (F=filia)................................................................................................................. 25
1 genetic value of F1 as mean of parent populations (........................................................................25
2 genetic value (real) based on gene frequencies in F1.......................................................................25
3 heterosis: difference between and................................................................................................... 25
7.4 the F2 generation.............................................................................................................................. 25
7.5 back crossing..................................................................................................................................... 25
7.6 maternal effects................................................................................................................................ 25
7.7 epistatic effects................................................................................................................................. 25
2
,2. Some principles in population genetics
2.1 Mendelian inheritance
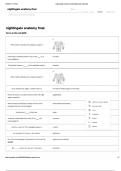
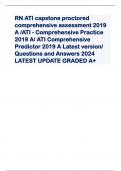
Example: Warmblood Fragile Foal Syndrome (WFFS)
- PLOD1 c.2032G>A : SNP (nucleotide GA) in gene PLOD1
- Causes deficient enzyme (collagen-molecules are not correctly connected)
‘fragile skin’
- Recessive gene: when homozygous foal dies
Mendel’s laws:
1. Genetic aptitude is transmitted from generation to generation by particles (later known as genes)
2. These particles (genes) are found in germ cells (in the nucleus) and are paired during fertilization
(1 from each parent)
3. Paired particles (genes) segregate independently (1allele) during production of reproduction cells
4. Contribution of particles to genetic aptitude of offspring is equal for both parents (alleles have an
equal chance of being passed on to the offspring)
5. Genetic information carried by one particle (of the pair) dominates genetic information carried by
the other particle (of the same pair) (dominant allele masks the expression of the recessive allele)
Example: 3:1 dominant: recessive
Deviations of Mendel’s laws: Rational basis
- Linkage: linked genes on the same chromosome (will not segregate)
- Partial dominance: the heterozygous phenotype is an intermediate of the two homozygous
phenotypes
- Genomic imprinting: one of both parents has more impact
2.2 The biometrical school
= a school of thought in genetics in the early 20th century analysis of observable traits
rather than the study of discrete Mendelian factors
Focussed on
1. Continuous variation: quantitative characteristics such as height, body weight,…
2. Statistical methods: continuous variation can be displayed in a ‘normal distribution’
makes statistical analysis possible
3. Polygenic inheritance: continuous traits are determined by the sum of the effects of a
large number of genes = infinitesimal model
4. Environmental influence: can contribute to variation in a population
Mendel vs biometrical school
Controversy between the 2 theories: caused by the fact that both schools concentrate on 2 different types
of traits (monogenic + polygenic)
- Biometric school (polygenic traits): traits determined by a lot of genes AND affected by the
environment
o black box: no analysis of mechanistic aspects of inheritance, only looking at the
outcomes and statistical patterns.
3
, - Mendelian school (monogenic traits): traits determined by a small number of genes -> known
biological mechanism
o Focus on how traits were influenced/determined by genes
Fisher showed that both paradigms are related
- Mendelian inheritance is the basis of: genetic variance and similarities between relatives
- variance = a statistical instrument in genetics, can be divided in a
o genetic component
o environment component
o later: further division in additive, dominant and epistatic gene effects
- Genes are located on chromosomes, and genes on the same chromosome are inherited together
(except cross-over)
2.3 Hardy-Weinberg’s law
In a large population with no selection, mutation or migration, the gene frequencies and the genotype
frequencies are constant from generation to generation and there is a simple relation between gene
frequencies and genotype frequencies
For one locus trait with 2 alleles: parent population
parent population (P) gametes offspring (F1)
Genotype Frequency Haplotype Frequency Genotyp frequency
e
AA P Produces A P+1/2H= p HW AA p²
Aa H gametes a 1/2H +Q=q conditions Aa pq
Aa Q with aA qp
haplotyes ‘A’ aa q²
and ‘a’
Total population : p² + 2pq + q² = 1 (= ‘panmixia’ situation)
HW conditions : ‘panmixia’ situation (mating occurs randomly and without any restrictions or
preferences) + no mutations, selection and migration
- Equal fertility in both parents (all individuals regardless of their genotype, contribute equally to the
next generation)
- Equal fertilization capacity of all gametes
- Large population (in fact ‘infinite’) (ensures that genetic drift is negligible)
- Equal gene frequency in father and mother (initial population is in
equilibrium)
- Zygotes have equal viability (no selection based on genotypes)
In HW equilibrium : p + q = 1
Proof: if we make an F2 out of the offspring (F1) (table)
Offspring F2
Haplotype Frequency
A 2p²+2pq = p²+pq=p(p+q)= p
a 2q²+2pq= q²+pq=q(p+q)=q
The gene frequencies will remain equal. The genetic variance will also be maintained.
Formal test of Hardy-Weinberg equilibrium: χ −test
2
(obs−exp)
χ 2=∑
exp
- Obs: observed genotype frequency
- Exp: expected genotype frequency under HW equilibrium (p+q=1)
4
, Usage of Hardy-Weinberg
Quality control on bi-allelic markers such as SNP-markers (single nucleotide polymorphisms):
- SNPs that deviate significantly from HW equilibrium may be flagged for further investigation
- Investigate why they are not in HW equilibrium (genotyping issues, selection, drift?)
- can make a difference in population dynamics
extension from biallelic loci to multiple alleles
locus A has n alleles: A1 , A 2 ,… , An each with frequency p1 , p2 , … , p n
there are n homozygotes (freq= p2i ) and n(n-1)/2 heterozygotes (freq=2 p i q j ) possible
n
expected heterozygosity (or gene diversity): H=1− ∑ p2i
i=1
2.4 The statistical nature of quantitative inheritance
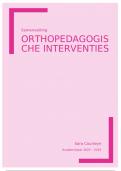
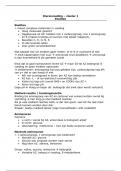
If a quantitative trait shows continuous variation, It is assumed that each genotype is the sum of:
→ The effects of different genes on different loci (additive)
o Usually each separate gene has a very small effect that
cannot be measured.
→ The interaction between the genes (dominance and epistasis)
→ The interaction of genes with the environment
o the phenotype is not only determined by the genotype, but
also the environment.
phenotype follows normal distribution/Gausscurve.
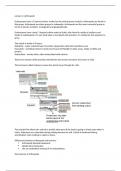
Proved by: ‘Central limit theorema’/law of
large numbers
In random samples of size n, the sample mean X will vary around the population mean µ
→ IF n increases, X comes closer to µ
σ
→ X is normally distributed with mean (µ) and standard deviation
√n
Each individual genotype is the sum of a large number of independent additive, dominant and epistatic
gene effects (on different chromosomes and loci).
→ According to the central limit theorema it can be expected that the genotyped values are
normally distributed, if the sample is large enough. Estimates for n: 20.000-25.000 animals.
2.5 The number of possible genotypes
quantitative genetics: the frequencies of the genotypes cannot be determined by classical Mendelian
rules because:
1. Classification into discrete classes is not possible because of the continuous variation
2. A large number of genotypes is possible because of a large number of gene effects
Assume an organism with N loci on chromosome pairs and rv alleles on the vth locus than:
1. Number of homozygous genotypes: rv
5
2. Some principles in population genetics..................................................................................................... 3
2.1 Mendelian inheritance........................................................................................................................ 3
2.2 The biometrical school........................................................................................................................ 3
Mendel vs biometrical school............................................................................................................... 3
2.3 Hardy-Weinberg’s law......................................................................................................................... 4
Usage of Hardy-Weinberg..................................................................................................................... 5
2.4 The statistical nature of quantitative inheritance................................................................................ 5
Proved by: ‘Central limit theorema’/law of large numbers...................................................................5
2.5 The number of possible genotypes..................................................................................................... 5
3. Factors affecting allele frequencies........................................................................................................... 7
3.1 Intoduction......................................................................................................................................... 7
3.2 Mutation............................................................................................................................................. 7
3.2.1 Single mutation............................................................................................................................ 7
3.2.2 Repetitive mutation..................................................................................................................... 7
3.2.3 frequency: repetitive & reverse mutation.................................................................................... 7
3.2.4 Number of mutations................................................................................................................... 8
3.3 Migration............................................................................................................................................ 8
3.4 Selection (and fitness)......................................................................................................................... 8
3.4.1 Selective disadvantage of an allele a............................................................................................ 9
3.4.2 Overvieuw all cases of dominance: calculation of genefrequency after selection........................9
3.4.3 selection: number of generations needed.................................................................................. 11
Equilibrium between mutation and selection.....................................................................................12
3.5 Genetic drift...................................................................................................................................... 12
3.5.1 drift: result of chance/coincidence............................................................................................. 12
3.5.2 genetic drift and micro-evolution............................................................................................... 13
3.5.3 factors that increase genetic drift:.............................................................................................. 13
3.5.4 The ideal population of Wright-Fisher........................................................................................ 13
3.5.5 Effective size Ne......................................................................................................................... 13
4. genetic variance...................................................................................................................................... 15
4.1 One locus model............................................................................................................................... 15
4.1.1 the effect of a gene (allele)......................................................................................................... 15
4.1.2 Breeding value in the one locus model....................................................................................... 16
4.2 two loci model.................................................................................................................................. 17
5. genetic relatedness................................................................................................................................. 18
5.1 Genetic relationship between individuals......................................................................................... 18
5.1.1 Sampling process during reproduction....................................................................................... 18
5.2 The identity of genes......................................................................................................................... 18
1
, 1 Coancestry coefficient...................................................................................................................... 18
2 additive genetic relationship coefficient........................................................................................... 18
3 The degree of relationship............................................................................................................... 19
4 The inbreeding coefficient................................................................................................................ 19
5.3 calculating the identity of genes........................................................................................................ 19
6. Inbreeding............................................................................................................................................... 21
6.1 Reduced performance....................................................................................................................... 21
6.2 compensate for inbreeding: mass selection...................................................................................... 22
6.3 Effective population size and the rate of inbreeding.........................................................................22
Rate of inbreeding............................................................................................................................... 22
6.4 inbreeding and depression: examples............................................................................................... 22
6.5 Genetic purging................................................................................................................................. 23
6.6 Inbred lines: inbreeding and genetic variance................................................................................... 23
1.7 conclusion..................................................................................................................................... 23
7. Crossbreeding (part A) – Crossing and the effect of crossing..................................................................25
7.1 reasons/effects of crossings.............................................................................................................. 25
7.2 Additive breed effect of crossbred.................................................................................................... 25
7.3 The F1 generation (F=filia)................................................................................................................. 25
1 genetic value of F1 as mean of parent populations (........................................................................25
2 genetic value (real) based on gene frequencies in F1.......................................................................25
3 heterosis: difference between and................................................................................................... 25
7.4 the F2 generation.............................................................................................................................. 25
7.5 back crossing..................................................................................................................................... 25
7.6 maternal effects................................................................................................................................ 25
7.7 epistatic effects................................................................................................................................. 25
2
,2. Some principles in population genetics
2.1 Mendelian inheritance
Example: Warmblood Fragile Foal Syndrome (WFFS)
- PLOD1 c.2032G>A : SNP (nucleotide GA) in gene PLOD1
- Causes deficient enzyme (collagen-molecules are not correctly connected)
‘fragile skin’
- Recessive gene: when homozygous foal dies
Mendel’s laws:
1. Genetic aptitude is transmitted from generation to generation by particles (later known as genes)
2. These particles (genes) are found in germ cells (in the nucleus) and are paired during fertilization
(1 from each parent)
3. Paired particles (genes) segregate independently (1allele) during production of reproduction cells
4. Contribution of particles to genetic aptitude of offspring is equal for both parents (alleles have an
equal chance of being passed on to the offspring)
5. Genetic information carried by one particle (of the pair) dominates genetic information carried by
the other particle (of the same pair) (dominant allele masks the expression of the recessive allele)
Example: 3:1 dominant: recessive
Deviations of Mendel’s laws: Rational basis
- Linkage: linked genes on the same chromosome (will not segregate)
- Partial dominance: the heterozygous phenotype is an intermediate of the two homozygous
phenotypes
- Genomic imprinting: one of both parents has more impact
2.2 The biometrical school
= a school of thought in genetics in the early 20th century analysis of observable traits
rather than the study of discrete Mendelian factors
Focussed on
1. Continuous variation: quantitative characteristics such as height, body weight,…
2. Statistical methods: continuous variation can be displayed in a ‘normal distribution’
makes statistical analysis possible
3. Polygenic inheritance: continuous traits are determined by the sum of the effects of a
large number of genes = infinitesimal model
4. Environmental influence: can contribute to variation in a population
Mendel vs biometrical school
Controversy between the 2 theories: caused by the fact that both schools concentrate on 2 different types
of traits (monogenic + polygenic)
- Biometric school (polygenic traits): traits determined by a lot of genes AND affected by the
environment
o black box: no analysis of mechanistic aspects of inheritance, only looking at the
outcomes and statistical patterns.
3
, - Mendelian school (monogenic traits): traits determined by a small number of genes -> known
biological mechanism
o Focus on how traits were influenced/determined by genes
Fisher showed that both paradigms are related
- Mendelian inheritance is the basis of: genetic variance and similarities between relatives
- variance = a statistical instrument in genetics, can be divided in a
o genetic component
o environment component
o later: further division in additive, dominant and epistatic gene effects
- Genes are located on chromosomes, and genes on the same chromosome are inherited together
(except cross-over)
2.3 Hardy-Weinberg’s law
In a large population with no selection, mutation or migration, the gene frequencies and the genotype
frequencies are constant from generation to generation and there is a simple relation between gene
frequencies and genotype frequencies
For one locus trait with 2 alleles: parent population
parent population (P) gametes offspring (F1)
Genotype Frequency Haplotype Frequency Genotyp frequency
e
AA P Produces A P+1/2H= p HW AA p²
Aa H gametes a 1/2H +Q=q conditions Aa pq
Aa Q with aA qp
haplotyes ‘A’ aa q²
and ‘a’
Total population : p² + 2pq + q² = 1 (= ‘panmixia’ situation)
HW conditions : ‘panmixia’ situation (mating occurs randomly and without any restrictions or
preferences) + no mutations, selection and migration
- Equal fertility in both parents (all individuals regardless of their genotype, contribute equally to the
next generation)
- Equal fertilization capacity of all gametes
- Large population (in fact ‘infinite’) (ensures that genetic drift is negligible)
- Equal gene frequency in father and mother (initial population is in
equilibrium)
- Zygotes have equal viability (no selection based on genotypes)
In HW equilibrium : p + q = 1
Proof: if we make an F2 out of the offspring (F1) (table)
Offspring F2
Haplotype Frequency
A 2p²+2pq = p²+pq=p(p+q)= p
a 2q²+2pq= q²+pq=q(p+q)=q
The gene frequencies will remain equal. The genetic variance will also be maintained.
Formal test of Hardy-Weinberg equilibrium: χ −test
2
(obs−exp)
χ 2=∑
exp
- Obs: observed genotype frequency
- Exp: expected genotype frequency under HW equilibrium (p+q=1)
4
, Usage of Hardy-Weinberg
Quality control on bi-allelic markers such as SNP-markers (single nucleotide polymorphisms):
- SNPs that deviate significantly from HW equilibrium may be flagged for further investigation
- Investigate why they are not in HW equilibrium (genotyping issues, selection, drift?)
- can make a difference in population dynamics
extension from biallelic loci to multiple alleles
locus A has n alleles: A1 , A 2 ,… , An each with frequency p1 , p2 , … , p n
there are n homozygotes (freq= p2i ) and n(n-1)/2 heterozygotes (freq=2 p i q j ) possible
n
expected heterozygosity (or gene diversity): H=1− ∑ p2i
i=1
2.4 The statistical nature of quantitative inheritance
If a quantitative trait shows continuous variation, It is assumed that each genotype is the sum of:
→ The effects of different genes on different loci (additive)
o Usually each separate gene has a very small effect that
cannot be measured.
→ The interaction between the genes (dominance and epistasis)
→ The interaction of genes with the environment
o the phenotype is not only determined by the genotype, but
also the environment.
phenotype follows normal distribution/Gausscurve.
Proved by: ‘Central limit theorema’/law of
large numbers
In random samples of size n, the sample mean X will vary around the population mean µ
→ IF n increases, X comes closer to µ
σ
→ X is normally distributed with mean (µ) and standard deviation
√n
Each individual genotype is the sum of a large number of independent additive, dominant and epistatic
gene effects (on different chromosomes and loci).
→ According to the central limit theorema it can be expected that the genotyped values are
normally distributed, if the sample is large enough. Estimates for n: 20.000-25.000 animals.
2.5 The number of possible genotypes
quantitative genetics: the frequencies of the genotypes cannot be determined by classical Mendelian
rules because:
1. Classification into discrete classes is not possible because of the continuous variation
2. A large number of genotypes is possible because of a large number of gene effects
Assume an organism with N loci on chromosome pairs and rv alleles on the vth locus than:
1. Number of homozygous genotypes: rv
5