HOW TO PASS BSTAT 3321 BUSINESS
STATISTICS I Assignment 2 University of
Texas, Arlington
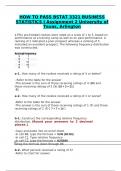
1. Fifty pro-football rookies were rated on a scale of 1 to 5, based on
performance at a training camp as well as on past performance. A
ranking of 1 indicated a poor prospect whereas a ranking of 5
indicated an excellent prospect. The following frequency distribution
was constructed.
RatingFrequency
1 7
2 7
3 15
4 18
5 3
a-1. How many of the rookies received a rating of 4 or better?
- Refer to the table for the answer
-The answer is the sum of those receiving ratings of 4 (18) and
those receiving ratings of 5 (3) [18 + 3 = 21]
-21
a-2. How many of the rookies received a rating of 2 or worse?
-Refer to the table for the answer
-The answer is the sum of those receiving ratings of 1 (7) and those
receiving ratings of 2 (7) [ 7 + 7 = 14 ]
-
b-1. Construct the corresponding relative frequency
distribution. (Round your answers to 2 decimal
places.)
-Copy and paste into an excel sheet
-In cell B8, type the formula = SUM (B2:B6)
-In cell C1, Type relative frequency
-In cell C2, type the formula = B2/$B$8
-Drag the formula down through B6
b-2. What percent received a rating of 5?
-Refer to chart for answer
,-3/50=6%
c. Select a bar chart for this data.
, • Bar Chart B
2. A statistics instructor is interested in the class status of her
students, which is defined as freshman, sophomore, junior, or
senior. She downloads her roster, a portion of which is shown in the
following table.
Student Status
1 Sophomore
2 Freshman
⋮ ⋮
60 Senior
Click here for the Excel Data File
a-1. Construct the frequency and relative frequency distributions.
(Round relative frequency to 2 decimal places.)
Status Frequency Relative Frequency
Freshman 20 20/60 = 0.33
Sophomore 24 24/60 = 0.40
Junior 10 10/60 = 0.17
Senior 6 6/60 = 0.10
Totals 60
STATISTICS I Assignment 2 University of
Texas, Arlington
1. Fifty pro-football rookies were rated on a scale of 1 to 5, based on
performance at a training camp as well as on past performance. A
ranking of 1 indicated a poor prospect whereas a ranking of 5
indicated an excellent prospect. The following frequency distribution
was constructed.
RatingFrequency
1 7
2 7
3 15
4 18
5 3
a-1. How many of the rookies received a rating of 4 or better?
- Refer to the table for the answer
-The answer is the sum of those receiving ratings of 4 (18) and
those receiving ratings of 5 (3) [18 + 3 = 21]
-21
a-2. How many of the rookies received a rating of 2 or worse?
-Refer to the table for the answer
-The answer is the sum of those receiving ratings of 1 (7) and those
receiving ratings of 2 (7) [ 7 + 7 = 14 ]
-
b-1. Construct the corresponding relative frequency
distribution. (Round your answers to 2 decimal
places.)
-Copy and paste into an excel sheet
-In cell B8, type the formula = SUM (B2:B6)
-In cell C1, Type relative frequency
-In cell C2, type the formula = B2/$B$8
-Drag the formula down through B6
b-2. What percent received a rating of 5?
-Refer to chart for answer
,-3/50=6%
c. Select a bar chart for this data.
, • Bar Chart B
2. A statistics instructor is interested in the class status of her
students, which is defined as freshman, sophomore, junior, or
senior. She downloads her roster, a portion of which is shown in the
following table.
Student Status
1 Sophomore
2 Freshman
⋮ ⋮
60 Senior
Click here for the Excel Data File
a-1. Construct the frequency and relative frequency distributions.
(Round relative frequency to 2 decimal places.)
Status Frequency Relative Frequency
Freshman 20 20/60 = 0.33
Sophomore 24 24/60 = 0.40
Junior 10 10/60 = 0.17
Senior 6 6/60 = 0.10
Totals 60