Qlik Sense - 4 Steps Of The Data Visualization Process
(Complete Study Guide)
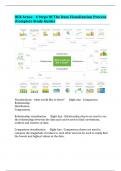
Visualizations - what would like to show? Right Ans - Comparison
Relationship
Distribution
Composition
Relationship visualization Right Ans - Relationship charts are used to see
the relationship between the data and can be used to find correlations,
outliers and clusters of data.
Comparison visualization Right Ans - Comparison charts are used to
compare the magnitude of values to each other and can be used to easily find
the lowest and highest values in the data.
, Distribution visualization Right Ans - Distribution charts are used to see
how quantitative values are distributed along an axis from lowest to highest.
Composition visualization Right Ans - Composition charts are used to see
how a part compares to the whole and how a total value can be divided into
shares.
What kind of composition visualizations do you know?
A. Changing over time and static
B. Among items and over time
C. Single variable and two variables
D. Two variables and three variables Right Ans - Correct answer:
A. Changing over time and static
A composition charts shows the relative value, but some charts can also be
used to show the absolute difference. The difference is between looking at
percentage of total and value of total.
What are the common questions for composition visualization? Right Ans -
Commons questions are
"how big part of the market to we have in a region" or
"what areas is our budget divided into".
Nice to know: composition visualization
Remember this... Right Ans - Composition - These visualizations refer to
data sets that change over time or include static data (do not occur over time
or are non-spacial).
With static data, a pie chart can work, however there are a host of other
options that can tell the same story.
With data that changes over time: the number of data points is a critical asset.
One should also consider that the axis needs to match the order of the data
(ergo in a stacked bar chart the years 1990-1999 should be listed in order as
opposed to by highest value).
Nice to know: Comparison visualization
Remember this... Right Ans - Comparison - These visualizations relate to
the time and size of your data. You are basically comparing multiple values: in
some cases the data is timed and in others it's itemized as you can see above.
Unfortunately there isn't one chart you can use for all-timed data; some
(Complete Study Guide)
Visualizations - what would like to show? Right Ans - Comparison
Relationship
Distribution
Composition
Relationship visualization Right Ans - Relationship charts are used to see
the relationship between the data and can be used to find correlations,
outliers and clusters of data.
Comparison visualization Right Ans - Comparison charts are used to
compare the magnitude of values to each other and can be used to easily find
the lowest and highest values in the data.
, Distribution visualization Right Ans - Distribution charts are used to see
how quantitative values are distributed along an axis from lowest to highest.
Composition visualization Right Ans - Composition charts are used to see
how a part compares to the whole and how a total value can be divided into
shares.
What kind of composition visualizations do you know?
A. Changing over time and static
B. Among items and over time
C. Single variable and two variables
D. Two variables and three variables Right Ans - Correct answer:
A. Changing over time and static
A composition charts shows the relative value, but some charts can also be
used to show the absolute difference. The difference is between looking at
percentage of total and value of total.
What are the common questions for composition visualization? Right Ans -
Commons questions are
"how big part of the market to we have in a region" or
"what areas is our budget divided into".
Nice to know: composition visualization
Remember this... Right Ans - Composition - These visualizations refer to
data sets that change over time or include static data (do not occur over time
or are non-spacial).
With static data, a pie chart can work, however there are a host of other
options that can tell the same story.
With data that changes over time: the number of data points is a critical asset.
One should also consider that the axis needs to match the order of the data
(ergo in a stacked bar chart the years 1990-1999 should be listed in order as
opposed to by highest value).
Nice to know: Comparison visualization
Remember this... Right Ans - Comparison - These visualizations relate to
the time and size of your data. You are basically comparing multiple values: in
some cases the data is timed and in others it's itemized as you can see above.
Unfortunately there isn't one chart you can use for all-timed data; some