Supply Chain Data Analytics
Table of Contents
Supply Chain Data Analytics ..............................................................................................1
Lecture 1 and 2: Introduction to Data Analytics, Forecasting and Smoothing Methods ............... 2
Lecture 3. Smoothing methods ............................................................................................... 12
Lecture 4: Regression Methods ............................................................................................... 16
Lecture 5: Time Series Regression ........................................................................................... 22
Lecture 6: AR, MA and ARIMA models .................................................................................... 26
Lecture 7: Introduction to Machine Learning ........................................................................... 30
Lecture 8: Supervised learning methods: logistic regression and K-nearest neighbors............... 34
Lecture 9: Supervised learning methods (decision trees) ......................................................... 39
Lecture 10: Unsupervised learning methods ........................................................................... 42
Lecture 11: Advanced Machine Learning Methods .................................................................. 45
,Lecture 1 and 2: Introduction to Data Analytics, Forecasting and Smoothing
Methods
Supply Chain Data analytics: The process of exploring and analyzing datasets to draw
conclusions
• Goal: extract value (insight) out of data to make better decisions
Demand forecasting: use historical sales data, market trends, customer behavior, economic
conditions to forecast future demand/sales
• Production planning
• Inventory optimization
Logistics and transportation optimization: use traffic patterns, fuel costs, delivery
schedules, vehicle availability to optimize transportation decisions
Supplier selection/performance analytics: use data on supplier performance, including
delivery times, quality metrics, costs to selects/assess suppliers
What are benefits of data analysis for supply chains:
• Efficiency gains: better resource utilization
• Cost savings: reduced operational/ transportation costs
• Customer satisfaction: improves service levels
• Sustainability: enhanced environmental / social responsibility
Data analytics key steps:
• Problem statement
o Understand the problem
o Define goals
• Data collection
o Gather the right data from various sources
• Data pre-processing, prepare data for analysis by
o Removing unwanted/duplicate values
o Handling missing values
• Data exploration
o Use tools and techniques such as data visualization to understand trends,
patterns and relationships within the data
• Data modelling/analysis
o Apply statistical or machine learning models to analyze the data and derive
insights
• Result interpretation and communication
o Translate the results and insights into clear, actionable, conclusions
o Communicated the results/insights using appropriate tools, charts, graphs
2
,Data analytics:
• Descriptive analytics (what happened)
o Summarize and describe historical data and provide insights into what has
happened
o Tools: basic statistics and data visualization (e.g. dashboards, charts, graphs)
• Diagnostic analytics (why happened)
o Dig deeper into data to understand why certain events or trends occurred by
identifying relationships
o Tools: data mining, correlation analysis
• Predictive analytics (what is likely to happen)
o Make forecasts about future outcomes based on historical data
o Tools: statistical models, machine learning
• Prescriptive analytics (what we should do)
o Recommend actions to achieve desired outcomes based on predictions/forecast
o Tools: optimization, algorithms, simulation, machine learning
Cross-sectional data: observations collected at a single point in time, representing different
subjects, individuals, entities or units
• E.g. sales of different companies for a given year
Time series data: observation collected sequentially over time (e.g. daily, monthly,
annually). Time of often the independent variable and the goals is to make a forecast for the
future
• E.g. stock prices of a company over the last five years
Time series data can be discrete or continuous
• Discrete: measurements are made at a set of discrete time points
• Continuous: measurements are made continuously through time (sample the series at
equal time intervals to convert continuous data into discrete point for analysis)
Forecasting: make predictions about future outcomes based on historical data
• Helps to cope with the impact of the future’s uncertainty by examining historical data
Forecasting process steps:
1. Define goals
2. Get data
3. Explore and Visualize data
4. Pre-processing
5. Partition Series
6. Apply Forecasting Method(s)
7. Evaluate & compare performance
8. Implement Forecasts/System
3
, Step 1. Define goal
• Ask questions to get sufficient background information
• Clarify the objectives in producing forecasts
• Find out how the forecast will be used by the organization
Step 2. Get data
• Data relevance
• Data quality
• Data sources
• Data frequency
• Data range
• Data consistency (in time intervals)
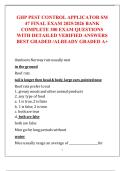
Step 3. Explore and visualize data
• Time plot: a graphical tool to visualize the
observations against the time of observation
• Spotting outliers and anomalies
• Detecting issues such as missing values and noise
• Identifying time series components (trends,
seasonality, cycle)
Time series components
• Systematic components:
o Level
o Trend (long-term increasing or decreasing)
o Seasonality
o Cycle
• Non-systematic component:
o Noise/Error
Level (𝜄𝑡 ): the average value of a time series for a specific time period
4
Table of Contents
Supply Chain Data Analytics ..............................................................................................1
Lecture 1 and 2: Introduction to Data Analytics, Forecasting and Smoothing Methods ............... 2
Lecture 3. Smoothing methods ............................................................................................... 12
Lecture 4: Regression Methods ............................................................................................... 16
Lecture 5: Time Series Regression ........................................................................................... 22
Lecture 6: AR, MA and ARIMA models .................................................................................... 26
Lecture 7: Introduction to Machine Learning ........................................................................... 30
Lecture 8: Supervised learning methods: logistic regression and K-nearest neighbors............... 34
Lecture 9: Supervised learning methods (decision trees) ......................................................... 39
Lecture 10: Unsupervised learning methods ........................................................................... 42
Lecture 11: Advanced Machine Learning Methods .................................................................. 45
,Lecture 1 and 2: Introduction to Data Analytics, Forecasting and Smoothing
Methods
Supply Chain Data analytics: The process of exploring and analyzing datasets to draw
conclusions
• Goal: extract value (insight) out of data to make better decisions
Demand forecasting: use historical sales data, market trends, customer behavior, economic
conditions to forecast future demand/sales
• Production planning
• Inventory optimization
Logistics and transportation optimization: use traffic patterns, fuel costs, delivery
schedules, vehicle availability to optimize transportation decisions
Supplier selection/performance analytics: use data on supplier performance, including
delivery times, quality metrics, costs to selects/assess suppliers
What are benefits of data analysis for supply chains:
• Efficiency gains: better resource utilization
• Cost savings: reduced operational/ transportation costs
• Customer satisfaction: improves service levels
• Sustainability: enhanced environmental / social responsibility
Data analytics key steps:
• Problem statement
o Understand the problem
o Define goals
• Data collection
o Gather the right data from various sources
• Data pre-processing, prepare data for analysis by
o Removing unwanted/duplicate values
o Handling missing values
• Data exploration
o Use tools and techniques such as data visualization to understand trends,
patterns and relationships within the data
• Data modelling/analysis
o Apply statistical or machine learning models to analyze the data and derive
insights
• Result interpretation and communication
o Translate the results and insights into clear, actionable, conclusions
o Communicated the results/insights using appropriate tools, charts, graphs
2
,Data analytics:
• Descriptive analytics (what happened)
o Summarize and describe historical data and provide insights into what has
happened
o Tools: basic statistics and data visualization (e.g. dashboards, charts, graphs)
• Diagnostic analytics (why happened)
o Dig deeper into data to understand why certain events or trends occurred by
identifying relationships
o Tools: data mining, correlation analysis
• Predictive analytics (what is likely to happen)
o Make forecasts about future outcomes based on historical data
o Tools: statistical models, machine learning
• Prescriptive analytics (what we should do)
o Recommend actions to achieve desired outcomes based on predictions/forecast
o Tools: optimization, algorithms, simulation, machine learning
Cross-sectional data: observations collected at a single point in time, representing different
subjects, individuals, entities or units
• E.g. sales of different companies for a given year
Time series data: observation collected sequentially over time (e.g. daily, monthly,
annually). Time of often the independent variable and the goals is to make a forecast for the
future
• E.g. stock prices of a company over the last five years
Time series data can be discrete or continuous
• Discrete: measurements are made at a set of discrete time points
• Continuous: measurements are made continuously through time (sample the series at
equal time intervals to convert continuous data into discrete point for analysis)
Forecasting: make predictions about future outcomes based on historical data
• Helps to cope with the impact of the future’s uncertainty by examining historical data
Forecasting process steps:
1. Define goals
2. Get data
3. Explore and Visualize data
4. Pre-processing
5. Partition Series
6. Apply Forecasting Method(s)
7. Evaluate & compare performance
8. Implement Forecasts/System
3
, Step 1. Define goal
• Ask questions to get sufficient background information
• Clarify the objectives in producing forecasts
• Find out how the forecast will be used by the organization
Step 2. Get data
• Data relevance
• Data quality
• Data sources
• Data frequency
• Data range
• Data consistency (in time intervals)
Step 3. Explore and visualize data
• Time plot: a graphical tool to visualize the
observations against the time of observation
• Spotting outliers and anomalies
• Detecting issues such as missing values and noise
• Identifying time series components (trends,
seasonality, cycle)
Time series components
• Systematic components:
o Level
o Trend (long-term increasing or decreasing)
o Seasonality
o Cycle
• Non-systematic component:
o Noise/Error
Level (𝜄𝑡 ): the average value of a time series for a specific time period
4