CEIS312:
INTRO TO ARTIFICIAL INTELLIGENCE
& MACHINE LEARNING
FINAL PROJECT – YOUR OWN ANALYSIS
Project By Damon Mock
INTRODUCTION
The project demonstrated in this report is to show what I have learned about how to use machine learning as a
tool for data analysis, with the use of the Microsoft Azure ML online environment. As data usage continues to grow
exponentially as time goes on, the demand for efficient, convenient methods of analyzing it grows evermore
alongside it. Machine learning and artificial intelligence provide dozens of tools for data analysis that are very
powerful, affordable, automatable, and so much more.
Objectives
Develop your own analysis.
Predict the customer reports rating on cereal based on the data given.
Scenario
Kaggle.com contains a variety of datasets for experimentation. One such dataset is the 80-cereals dataset. This
dataset contains the consumer reports rating of several different cereals along with various data about the
cereals.
Prompt
Create a new experiment in Azure Machine Learning and perform linear regression on the cereals.csv dataset.
We are seeking to determine if we can predict the rating based on the above features. The ratings are based
on nutrition and taste. Open the cereals.csv file and look through the data to familiarize yourself with the
data.
You will need to cleanse the data—are there any missing values? Any outliers? Do you need to make any fields
categorical? You will also need to normalize the data. You will want to develop Python visualizations (feel free
to use the code we have used in previous examples to create a pairwise scatter plot).
You may also want to focus on a few selected fields based on your visualizations (sugar, calories, fat, fiber,
etc.). Don’t forget to split the data into a training and test set. You will need to create a linear regression
model, train the model, score the model, and then evaluate it.
, PART ONE: DATA PREPARATION, CLEANSING, & NORMALIZATION
Data Prep and Cleaning
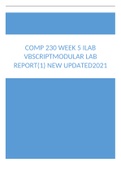
After examining and uploading the dataset provided to Azure ML, I first chose to clean any missing and/or
duplicate data. This helps to provide more accurate predictions later in a model.
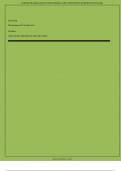
Normalization
Next, I excluded the weight, shelf, and cup values from the dataset. These values do not apply to the ratings, as
they do not influence nutritional value or taste of the cereals. Following this, I normalized the dataset by
constraining it to a range between 0 and 1.
By doing this, the model keeps the same scale of the numerical data provided before the normalization process,
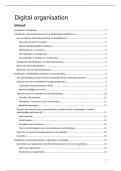
without distorting or removing the values. Next, I created the “Execute Python Script” model and used the
provided Python code to create a pair-wise scatter plot for further analysis.
INTRO TO ARTIFICIAL INTELLIGENCE
& MACHINE LEARNING
FINAL PROJECT – YOUR OWN ANALYSIS
Project By Damon Mock
INTRODUCTION
The project demonstrated in this report is to show what I have learned about how to use machine learning as a
tool for data analysis, with the use of the Microsoft Azure ML online environment. As data usage continues to grow
exponentially as time goes on, the demand for efficient, convenient methods of analyzing it grows evermore
alongside it. Machine learning and artificial intelligence provide dozens of tools for data analysis that are very
powerful, affordable, automatable, and so much more.
Objectives
Develop your own analysis.
Predict the customer reports rating on cereal based on the data given.
Scenario
Kaggle.com contains a variety of datasets for experimentation. One such dataset is the 80-cereals dataset. This
dataset contains the consumer reports rating of several different cereals along with various data about the
cereals.
Prompt
Create a new experiment in Azure Machine Learning and perform linear regression on the cereals.csv dataset.
We are seeking to determine if we can predict the rating based on the above features. The ratings are based
on nutrition and taste. Open the cereals.csv file and look through the data to familiarize yourself with the
data.
You will need to cleanse the data—are there any missing values? Any outliers? Do you need to make any fields
categorical? You will also need to normalize the data. You will want to develop Python visualizations (feel free
to use the code we have used in previous examples to create a pairwise scatter plot).
You may also want to focus on a few selected fields based on your visualizations (sugar, calories, fat, fiber,
etc.). Don’t forget to split the data into a training and test set. You will need to create a linear regression
model, train the model, score the model, and then evaluate it.
, PART ONE: DATA PREPARATION, CLEANSING, & NORMALIZATION
Data Prep and Cleaning
After examining and uploading the dataset provided to Azure ML, I first chose to clean any missing and/or
duplicate data. This helps to provide more accurate predictions later in a model.
Normalization
Next, I excluded the weight, shelf, and cup values from the dataset. These values do not apply to the ratings, as
they do not influence nutritional value or taste of the cereals. Following this, I normalized the dataset by
constraining it to a range between 0 and 1.
By doing this, the model keeps the same scale of the numerical data provided before the normalization process,
without distorting or removing the values. Next, I created the “Execute Python Script” model and used the
provided Python code to create a pair-wise scatter plot for further analysis.