Summary 7W3X0
, Lecture 1 – Literature
Activity-Based Travel Demand Models: A Primer
Travel models are created to support decision making by providing information about the impacts of
alternative transportation and land use investments and policies, as well as demographic and
economic trends.
- Is an analysis tool that provides a systematic framework for representing how travel demand
changes in response to different input assumptions.
Different types of models used in transportation planning:
- Sketch-planning models: simplest type of travel models, designed to produce rough
estimated of travel demand where order-of-magnitude information is all that is required.
Only appropriate for specific targeted analyses
- Strategic-planning models: used to analyse many scenarios quicly and implemented using
basic software and hardware. Useful for testing a wide range of large-scale policy and
investment alternatives
- Trip-based models: use the individual trip as the fundamental unit of analysis, often include
four primary components (4-step model):
1. Estimate the numbers of trips produced by and attracted to each zone
2. Connect where trips are produced and where they are attracted to
3. Determine the travel mode used for each trip’
4. Predict the specific network facilities or routes used for each trip
- Activity-based models: represent each person’s activity and travel choices across the entire
day, considering the types of activities and setting the priorities for scheduling these
activities. These models share some similarities with the trip-based models, but has several
advantages over trip-based model:
1. Explicit representation of realistic constraints of time and space and the linkages
among activities and travel
Linkages enable them to more realistically represent the effect of travel
conditions on activity and travel choices
2. Incorporate the influence of very detailed person-level and household-level
attributes
3. Ability to produce detailed information across a broader set of performance metrics
Activity-based models are often used to evaluate alternative investments and policies due to:
- Activity-based models’ function at the level of individual persons, model is more sensitive to
pricing policies that may vary by time of day
- Activity-based models produce more detailed performance metrics
Deficiencies of Trip-Based models:
- Assume that all trips are made independently, do not recognize that the locations, travel
models, and timing of travel made by an individual are interrelated.
1. Can’t provide an answer for questions asking how to manage the existing
transportation systems the most efficient
, - Assume that group characteristics are shared by all the individuals who are members of that
group, thus that households share the same attribute values to make forecasts.
1. Compromises the reliance on differentiating alternatives
2. Limits the ability to provide detailed information on the impacts of these alternatives
Features of activity-based models:
- Individual travellers: each individual traveller chains of trips are modelled as part of
generating overall daily activity patterns
1. Provides the ability to represent greater variation across the population
2. Easily incorporate new explanatory variables and new sensitivities
- Interrelated Decision Making: represent the interrelated aspects of activity and travel
choices for all travel conducted by a person or household during a day, including purpose,
location, timing and travel modes
1. Result in a more detailed representation of how traveller may respond to investment
and policy alternatives, land use, and socioeconomic changes
- Detailed information: incorporate significantly more detailed outputs due to use of wider
range of important explanatory variables
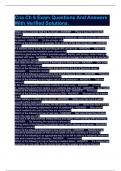
Activity-based models are often embedded within a basic integrated model system which predicts
how demand affects the performance of the transportation network and relates trip-based and
activity-based models. Consists of the following components:
- Population Synthesis Models: create detailed,
synthetic representations of populations of
individuals within households. Used to simulate
the choices
- Activity-Based model: already known
- Auxiliary models: provide information about
truck and commercial travel, as well as special
purpose travel
- Network supply models: predicted flows of travel
by time of day and mode are assigned to
roadway, transit, and other networks
Multiple considerations when developing an activity-based model:
- Data: use of household travel survey information, economic and demographic information
and representations of networks
- Staff and consultant requirements: necessary for the modelling staff to have good
understanding of activity-based modelling and its statistical modelling methods
- Costs and schedule: not significantly higher than for trip-based modelling
- Model run times
- Stakeholder acceptance: stakeholders should accept
the usefulness of the model outputs
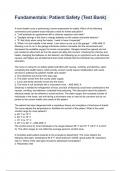
As mentioned before, activity-based models are always
embedded within a basic integrated model system. They can
also be integrated with other models to create an extended
integrated model system:
- Land use models: provide more detailed information
about sub regional land use development, economy,
employment, and population.
- Demographic models: show how the population is
expected to change over time
, Lecture 1 – Literature
Activity-Based Travel Demand Models: A Primer
Travel models are created to support decision making by providing information about the impacts of
alternative transportation and land use investments and policies, as well as demographic and
economic trends.
- Is an analysis tool that provides a systematic framework for representing how travel demand
changes in response to different input assumptions.
Different types of models used in transportation planning:
- Sketch-planning models: simplest type of travel models, designed to produce rough
estimated of travel demand where order-of-magnitude information is all that is required.
Only appropriate for specific targeted analyses
- Strategic-planning models: used to analyse many scenarios quicly and implemented using
basic software and hardware. Useful for testing a wide range of large-scale policy and
investment alternatives
- Trip-based models: use the individual trip as the fundamental unit of analysis, often include
four primary components (4-step model):
1. Estimate the numbers of trips produced by and attracted to each zone
2. Connect where trips are produced and where they are attracted to
3. Determine the travel mode used for each trip’
4. Predict the specific network facilities or routes used for each trip
- Activity-based models: represent each person’s activity and travel choices across the entire
day, considering the types of activities and setting the priorities for scheduling these
activities. These models share some similarities with the trip-based models, but has several
advantages over trip-based model:
1. Explicit representation of realistic constraints of time and space and the linkages
among activities and travel
Linkages enable them to more realistically represent the effect of travel
conditions on activity and travel choices
2. Incorporate the influence of very detailed person-level and household-level
attributes
3. Ability to produce detailed information across a broader set of performance metrics
Activity-based models are often used to evaluate alternative investments and policies due to:
- Activity-based models’ function at the level of individual persons, model is more sensitive to
pricing policies that may vary by time of day
- Activity-based models produce more detailed performance metrics
Deficiencies of Trip-Based models:
- Assume that all trips are made independently, do not recognize that the locations, travel
models, and timing of travel made by an individual are interrelated.
1. Can’t provide an answer for questions asking how to manage the existing
transportation systems the most efficient
, - Assume that group characteristics are shared by all the individuals who are members of that
group, thus that households share the same attribute values to make forecasts.
1. Compromises the reliance on differentiating alternatives
2. Limits the ability to provide detailed information on the impacts of these alternatives
Features of activity-based models:
- Individual travellers: each individual traveller chains of trips are modelled as part of
generating overall daily activity patterns
1. Provides the ability to represent greater variation across the population
2. Easily incorporate new explanatory variables and new sensitivities
- Interrelated Decision Making: represent the interrelated aspects of activity and travel
choices for all travel conducted by a person or household during a day, including purpose,
location, timing and travel modes
1. Result in a more detailed representation of how traveller may respond to investment
and policy alternatives, land use, and socioeconomic changes
- Detailed information: incorporate significantly more detailed outputs due to use of wider
range of important explanatory variables
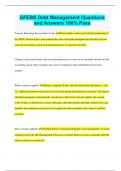
Activity-based models are often embedded within a basic integrated model system which predicts
how demand affects the performance of the transportation network and relates trip-based and
activity-based models. Consists of the following components:
- Population Synthesis Models: create detailed,
synthetic representations of populations of
individuals within households. Used to simulate
the choices
- Activity-Based model: already known
- Auxiliary models: provide information about
truck and commercial travel, as well as special
purpose travel
- Network supply models: predicted flows of travel
by time of day and mode are assigned to
roadway, transit, and other networks
Multiple considerations when developing an activity-based model:
- Data: use of household travel survey information, economic and demographic information
and representations of networks
- Staff and consultant requirements: necessary for the modelling staff to have good
understanding of activity-based modelling and its statistical modelling methods
- Costs and schedule: not significantly higher than for trip-based modelling
- Model run times
- Stakeholder acceptance: stakeholders should accept
the usefulness of the model outputs
As mentioned before, activity-based models are always
embedded within a basic integrated model system. They can
also be integrated with other models to create an extended
integrated model system:
- Land use models: provide more detailed information
about sub regional land use development, economy,
employment, and population.
- Demographic models: show how the population is
expected to change over time