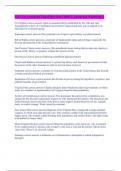
Utility: measure of satisfaction (units = utils)
Utility function: shows the relationship between a consumer's utility and the combination of
goods + services (consumption bundle) they consume
● Increases at a decreasing rate before decreasing
Marginal utility/benefit: U after - U before
Marginal cost: how much each new unit costs
Marginal utility curve: shows relationship between quality of good and marginal utility
● Decreasing linear b/c each additional good gives consumer less utility than the previous
(principle of diminishing marginal utility)
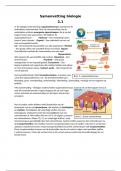
Consumption possibilities: all affordable
consumption bundles
Budget line: Shows all consumption bundles
available when all income is spent
● Below line: affordable
● On line: affordable + costs all of income
● Above line: unaffordable
● Oppourntity cost of consuming more of one is
consuming less of the other
Optimal consumption bundle: the consumption bundle that
maximizes total utility (found on budget line)
● Marginal utility of good A / price of good A =
Marginal utility of good B / price of good B
● MUA/PA = MUB/PB - you want less of the good
that’s giving you less marginal utility per dollar (want less
cuz it’s worse); more of the good that’s giving you more
utility per dollar (wants more cuz it’s better)
Marginal utility per dollar: how much additional utility
someone gets from spending an additional dollar on either
good
● Marginal utility/price
**You continue to consume until MARGINAL BENEFIT =
MARGINAL COST
***If the marginal cost is not EXACTLY attained by any
whole input, round down an input
, ex. If MC is $2 and MB at 5 = $3 and MB at 6 = $1, the consumer should stop consuming
at 5
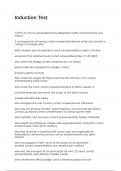
3 STAGES OF RETURNS
Stage I: Increasing marginal returns
● Marginal product is rising
● Total product is increasing at
an increasing rate b/c of specialization
Stage II: Decreasing marginal returns
● Marginal product is falling
● Total product increases at a
decreasing rate
Stage III: Negative marginal returns
● Marginal product is negative
● Total product is decreasing
*Think of TP as f(x) and MP as f'(x)
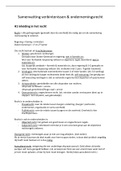
The Production Function - Marginal Product Curve
Production function: input (x-axis) v. output (y-axis)
Fixed input: an input who quantity is fixed for a period of time
and cannot be varied
Variable input: an input whose quantity the firm can vary at
any time
→ In the long run, firms can adjust the quantity of any input
→ In the short run, at least one input is fixed
Marginal product (of labor): the additional quantity of
output from using one more unit of input
= CHANGE IN OUTPUT/CHANGE IN LABOR
(slope of the production function)
→ difference between consecutive terms
Total (physical) product: total output/quantity produced
Avg product = TP/units of labor
Diminishing returns to labor: as input increases at a
constant rate, marginal product of labor decreases
"too many cooks in the kitchen"
→ MPL curve downsloping
Utility function: shows the relationship between a consumer's utility and the combination of
goods + services (consumption bundle) they consume
● Increases at a decreasing rate before decreasing
Marginal utility/benefit: U after - U before
Marginal cost: how much each new unit costs
Marginal utility curve: shows relationship between quality of good and marginal utility
● Decreasing linear b/c each additional good gives consumer less utility than the previous
(principle of diminishing marginal utility)
Consumption possibilities: all affordable
consumption bundles
Budget line: Shows all consumption bundles
available when all income is spent
● Below line: affordable
● On line: affordable + costs all of income
● Above line: unaffordable
● Oppourntity cost of consuming more of one is
consuming less of the other
Optimal consumption bundle: the consumption bundle that
maximizes total utility (found on budget line)
● Marginal utility of good A / price of good A =
Marginal utility of good B / price of good B
● MUA/PA = MUB/PB - you want less of the good
that’s giving you less marginal utility per dollar (want less
cuz it’s worse); more of the good that’s giving you more
utility per dollar (wants more cuz it’s better)
Marginal utility per dollar: how much additional utility
someone gets from spending an additional dollar on either
good
● Marginal utility/price
**You continue to consume until MARGINAL BENEFIT =
MARGINAL COST
***If the marginal cost is not EXACTLY attained by any
whole input, round down an input
, ex. If MC is $2 and MB at 5 = $3 and MB at 6 = $1, the consumer should stop consuming
at 5
3 STAGES OF RETURNS
Stage I: Increasing marginal returns
● Marginal product is rising
● Total product is increasing at
an increasing rate b/c of specialization
Stage II: Decreasing marginal returns
● Marginal product is falling
● Total product increases at a
decreasing rate
Stage III: Negative marginal returns
● Marginal product is negative
● Total product is decreasing
*Think of TP as f(x) and MP as f'(x)
The Production Function - Marginal Product Curve
Production function: input (x-axis) v. output (y-axis)
Fixed input: an input who quantity is fixed for a period of time
and cannot be varied
Variable input: an input whose quantity the firm can vary at
any time
→ In the long run, firms can adjust the quantity of any input
→ In the short run, at least one input is fixed
Marginal product (of labor): the additional quantity of
output from using one more unit of input
= CHANGE IN OUTPUT/CHANGE IN LABOR
(slope of the production function)
→ difference between consecutive terms
Total (physical) product: total output/quantity produced
Avg product = TP/units of labor
Diminishing returns to labor: as input increases at a
constant rate, marginal product of labor decreases
"too many cooks in the kitchen"
→ MPL curve downsloping