UNIT 1: BASIC ECONOMIC CONCEPTS
Study of Economics
Individual choice: making a choice among a limited number of alternatives
Economic interaction: how each other's choices affect everyone
Economy: system that coordinates production + consumption choices
● Distributes goods + services to those who want them
○ Consumer goods: created for direct consumption
○ Capital goods: created for indirect consumption
■ ex. ovens, blenders, knives
■ Goods used to MAKE consumer goods
● Market economy: reduction + consumption = result of decentralized decisions
○ Firms, individuals
○ Driven by profit
● Command economy: the industry is publically owned + central authority present
○ Lack of response to demand
○ Producers can't produce b/c lack of raw materials
■ Lack of incentives
○ Consumers don't want mandated products
Property rights: est. ownership + grant individuals right to trade goods + services
● Right to own property → incentive to produce things of value (to keep + trade)
Marginal decisions: trade-offs @ margin
● Costs/benefits of doing a little more vs. less
● Marginal analysis: study of whether or not an activity is worth continuing
Resource: anything that can be used to produce something else
● Factors of production
○ Land
○ Labor
○ Capital
○ Entrepreneurship
● Scrace: not enough to satisfy ways society wants to use it
Limited things:
1. Time
2. Income
3. Resources
Opportunity cost: what you must give up when you make a choice
Positive economics: economic analysis to answer questions about how the world works
Normative economies: analysis of how the world should work
,Production Possibilities Curve/Frontier
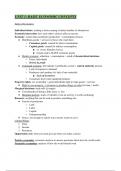
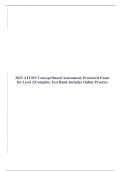
Production possibilities curve model: helps
economists think about the trade-offs every
economy faces. Helps us understand:
1. Efficiency
a. Efficient: no missed opportunities,
no way to some better off without
making others worse off
i. Efficient in allocation:
requires econ allocate
resources so everyone is as
well off as possible
ii. Efficient in productivity:
products are being produced in the least costly way
iii. PRODUCTION (as much as possible) + ALLOCATION (mix of goods)
= EFFICIENCY
iv. Inside curve = feasible but inefficient
v. Outside curve = not feasible
vi. On curve = feasible and efficient
b. Inefficiency can be caused by involuntary employment — could produce more
output if these people were employed
i. Greater unemployment = points further below PPC
ii. Unemployment dec, possibilities in economy inc
2. Opportunity cost: true cost of a good is price + everything else in addition to money
given up to get the good
a. Trade-off: give up smth for smth else
i. "How much of Good 1 can I have
if I also want x amount of Good
2?"
b. Constant opportunity cost: resources
are easily adaptable for producing either
good (straight line PPC)
c. Increasing opportunity cost: more of
Good #1 = giving up more of Good #2
i. Good sare not perfectly
adaptable/substitutable
ii. Law of increasing opporutnity cost: as you produce more of any good, the
opp cost will increase
, 3. Economic growth: sustained rise in
aggregate output expansion of economy's
production possibilities (PPC shift)
a. Sources:
i. Increase in resources to
produce goods + services
1. Labor, land,
capital,
entrepreneurship
ii. Technology: technical
means for production
Comparative Advantage and Trade
Trade: division of tasks (specialization) +
each person provides service that other
people want in return for other stuff (gains
from trade)
Comparative advantage: if the
opportunity cost of production is lower for
that individual than others
● Least oppoutnity cost
○ Diff opp costs = opp for deal =
only engage in the deal if new
price offered by partner is less
than original, individual
opporutnity cost
● Output cost:
○ Output goes over
○ Amt of A produced/Amt of B
produced = how much it costs to
produce B
■ "How much of one does it take to produce one unit of another"
● Input cost:
○ Input goes under
○ Amt of A produced/Amt of B produced = cost of A
■ Trying to find how much one unit of production costs in terms of the other
— how resources (like time) are used relatively
, Absolute advantage: the producer that can produce the most output or requires the least amount
of inputs
Terms of Trade: The agreed-upon conditions that would benefit both countries.
● Both countries can benefit from trade if they each have relatively lower opportunity costs.
UNIT 2 PT.1: SUPPLY AND DEMAND
Demand
Market: a group of producers and consumers who exchange a good service for payment
● Competitive market: market w/many buyers + sellers of the same good/service
○ No individual actions have noticeable effect on price
○ Behavior described by SUPPLY + DEMAND MODEL
**LAW OF DEMAND: there is an indirect realtionship between demand and price and quantity
supplied
Occurs due to:
1. Substitution effect
2. Income effect
3. Law of diminsihing marginal utility
● Demand schedule: table showing how much of a good/service consumers want to buy at
diff prices
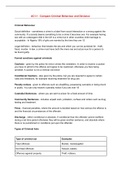
● Demand curve: graphical
representation of demand schedule
○ Quantity demanded: actual
amount consumers are willing to
buy (on demand curve)
■ Movements along the
demand curve are
changes in Qdemanded
of a good that result
from a change in that
good's price
○ CHANGE IN DEMAND: increase in quantity demanded @ given price
■ Increase = rightward shift
■ Decrease = leftward shift
○ SHIFTERS:
1. Changes in prices of related goods + services
Study of Economics
Individual choice: making a choice among a limited number of alternatives
Economic interaction: how each other's choices affect everyone
Economy: system that coordinates production + consumption choices
● Distributes goods + services to those who want them
○ Consumer goods: created for direct consumption
○ Capital goods: created for indirect consumption
■ ex. ovens, blenders, knives
■ Goods used to MAKE consumer goods
● Market economy: reduction + consumption = result of decentralized decisions
○ Firms, individuals
○ Driven by profit
● Command economy: the industry is publically owned + central authority present
○ Lack of response to demand
○ Producers can't produce b/c lack of raw materials
■ Lack of incentives
○ Consumers don't want mandated products
Property rights: est. ownership + grant individuals right to trade goods + services
● Right to own property → incentive to produce things of value (to keep + trade)
Marginal decisions: trade-offs @ margin
● Costs/benefits of doing a little more vs. less
● Marginal analysis: study of whether or not an activity is worth continuing
Resource: anything that can be used to produce something else
● Factors of production
○ Land
○ Labor
○ Capital
○ Entrepreneurship
● Scrace: not enough to satisfy ways society wants to use it
Limited things:
1. Time
2. Income
3. Resources
Opportunity cost: what you must give up when you make a choice
Positive economics: economic analysis to answer questions about how the world works
Normative economies: analysis of how the world should work
,Production Possibilities Curve/Frontier
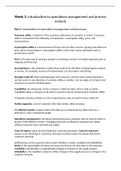
Production possibilities curve model: helps
economists think about the trade-offs every
economy faces. Helps us understand:
1. Efficiency
a. Efficient: no missed opportunities,
no way to some better off without
making others worse off
i. Efficient in allocation:
requires econ allocate
resources so everyone is as
well off as possible
ii. Efficient in productivity:
products are being produced in the least costly way
iii. PRODUCTION (as much as possible) + ALLOCATION (mix of goods)
= EFFICIENCY
iv. Inside curve = feasible but inefficient
v. Outside curve = not feasible
vi. On curve = feasible and efficient
b. Inefficiency can be caused by involuntary employment — could produce more
output if these people were employed
i. Greater unemployment = points further below PPC
ii. Unemployment dec, possibilities in economy inc
2. Opportunity cost: true cost of a good is price + everything else in addition to money
given up to get the good
a. Trade-off: give up smth for smth else
i. "How much of Good 1 can I have
if I also want x amount of Good
2?"
b. Constant opportunity cost: resources
are easily adaptable for producing either
good (straight line PPC)
c. Increasing opportunity cost: more of
Good #1 = giving up more of Good #2
i. Good sare not perfectly
adaptable/substitutable
ii. Law of increasing opporutnity cost: as you produce more of any good, the
opp cost will increase
, 3. Economic growth: sustained rise in
aggregate output expansion of economy's
production possibilities (PPC shift)
a. Sources:
i. Increase in resources to
produce goods + services
1. Labor, land,
capital,
entrepreneurship
ii. Technology: technical
means for production
Comparative Advantage and Trade
Trade: division of tasks (specialization) +
each person provides service that other
people want in return for other stuff (gains
from trade)
Comparative advantage: if the
opportunity cost of production is lower for
that individual than others
● Least oppoutnity cost
○ Diff opp costs = opp for deal =
only engage in the deal if new
price offered by partner is less
than original, individual
opporutnity cost
● Output cost:
○ Output goes over
○ Amt of A produced/Amt of B
produced = how much it costs to
produce B
■ "How much of one does it take to produce one unit of another"
● Input cost:
○ Input goes under
○ Amt of A produced/Amt of B produced = cost of A
■ Trying to find how much one unit of production costs in terms of the other
— how resources (like time) are used relatively
, Absolute advantage: the producer that can produce the most output or requires the least amount
of inputs
Terms of Trade: The agreed-upon conditions that would benefit both countries.
● Both countries can benefit from trade if they each have relatively lower opportunity costs.
UNIT 2 PT.1: SUPPLY AND DEMAND
Demand
Market: a group of producers and consumers who exchange a good service for payment
● Competitive market: market w/many buyers + sellers of the same good/service
○ No individual actions have noticeable effect on price
○ Behavior described by SUPPLY + DEMAND MODEL
**LAW OF DEMAND: there is an indirect realtionship between demand and price and quantity
supplied
Occurs due to:
1. Substitution effect
2. Income effect
3. Law of diminsihing marginal utility
● Demand schedule: table showing how much of a good/service consumers want to buy at
diff prices
● Demand curve: graphical
representation of demand schedule
○ Quantity demanded: actual
amount consumers are willing to
buy (on demand curve)
■ Movements along the
demand curve are
changes in Qdemanded
of a good that result
from a change in that
good's price
○ CHANGE IN DEMAND: increase in quantity demanded @ given price
■ Increase = rightward shift
■ Decrease = leftward shift
○ SHIFTERS:
1. Changes in prices of related goods + services