Grasple summary
Contents
Variables.................................................................................................................................................3
Measurement levels...............................................................................................................................3
Population and Sample...........................................................................................................................4
Frequency tables....................................................................................................................................4
Mode......................................................................................................................................................5
Symbols..................................................................................................................................................5
Mean......................................................................................................................................................6
Median...................................................................................................................................................6
Bar graph................................................................................................................................................7
Histogram...............................................................................................................................................7
Quartiles.................................................................................................................................................7
Box plot..................................................................................................................................................9
Validity and reliability.............................................................................................................................9
Sampling variation..................................................................................................................................9
Standard deviation...............................................................................................................................10
Standard deviation of a sample............................................................................................................11
Normal distribution..............................................................................................................................12
Sampling distribution...........................................................................................................................13
The three distributions.........................................................................................................................13
Central Limit Theorem..........................................................................................................................13
Standard Error......................................................................................................................................14
Point vs. Interval Estimates..................................................................................................................15
Confidence Intervals for the Mean (conceptual)..................................................................................15
Z-score..................................................................................................................................................16
Value to Probability..............................................................................................................................16
Probability to Value..............................................................................................................................17
Probability Intervals..............................................................................................................................17
Z-Score to Z-Test...................................................................................................................................17
Z-Test....................................................................................................................................................17
Hypothesis Testing...............................................................................................................................18
Type-I and Type-II errors......................................................................................................................20
P-value..................................................................................................................................................20
t-Distribution........................................................................................................................................21
One-sample t-test.................................................................................................................................21
,Grasple summary
Two-sample t-test.................................................................................................................................22
Choosing a suitable Statistical Test.......................................................................................................23
Analysis Schema...................................................................................................................................24
Two-sample t-Test: Equal Variances.....................................................................................................24
, Grasple summary
Variables
Everything that is being measured, questioned, or kept a record of in research is contained in
variables. A variable can take on different values for different individuals, like age or gender.
Information is also called data. A dataset contains information about all participants and all variables.
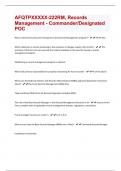
A dataset looks like this: every row displays a participant. So the number of rows is equal to the
number of participants in the research. Every column displays a variable.
Measurement levels
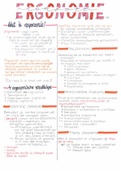
Suppose you have 12 buckets filled with several different colors of paint: 6 with red paint, 4 with
blue paint and 2 with green paint. What is the average color?
- Cannot be calculated
This is because there are different Levels of Measurement. The measurement level of the variable(s)
determines which statistical tools you can use. To pick the correct statistical tool, you need to
determine the measurement level of your variables. In this lesson you will be introduced to the four
measurement levels.
You can divide all variables into two groups:
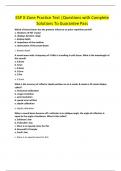
- Categorical variables (measured in groups/categories)
o Nominal: based on a qualitative classification without any logical ranking.
An example of a nominal variable are colors, such as red, blue and green.
There is no inherent ranking in a list of different colors. Red, blue, green
contains the same information as blue, red, green.
o Ordinal: based on a qualitive classification with logical ranking.
An example of an ordinal variable are weather alarms. These often range
from none to yellow, orange and then red. There is an inherent ranking in
these different levels.
- Continuous variables (measured on a continuous scale)
o Interval: measured on a numerical scale, without an absolute zero value.
An example of an interval variable is sea level rise. The differences between
the values are meaningful for interval variables. For example, the difference
between 1 and 2 meters is the same as the difference between 2 and 3
meters. Interval variables do not have an absolute zero, even if the value is 0.
Negative sea level rise can also be recorded. Therefore, the value 0 is not an
absolute zero.
o Ratio: measured on a numerical scale, with an absolute zero value.
Examples of ratio variable are height and weight. A height or weight of zero
indicates that the object you are measuring does not have a height or a
weight. In fact, negative weight or length cannot be measured.
Furthermore, the differences between the different measurements are meaningful for both
ratio variables. For example, the difference between 1.30m and 1.40m is the same as the
difference between 1.40m and 1.50m. In addition, you can state that a 200m sprint is twice
as long as a 100m sprint.
Contents
Variables.................................................................................................................................................3
Measurement levels...............................................................................................................................3
Population and Sample...........................................................................................................................4
Frequency tables....................................................................................................................................4
Mode......................................................................................................................................................5
Symbols..................................................................................................................................................5
Mean......................................................................................................................................................6
Median...................................................................................................................................................6
Bar graph................................................................................................................................................7
Histogram...............................................................................................................................................7
Quartiles.................................................................................................................................................7
Box plot..................................................................................................................................................9
Validity and reliability.............................................................................................................................9
Sampling variation..................................................................................................................................9
Standard deviation...............................................................................................................................10
Standard deviation of a sample............................................................................................................11
Normal distribution..............................................................................................................................12
Sampling distribution...........................................................................................................................13
The three distributions.........................................................................................................................13
Central Limit Theorem..........................................................................................................................13
Standard Error......................................................................................................................................14
Point vs. Interval Estimates..................................................................................................................15
Confidence Intervals for the Mean (conceptual)..................................................................................15
Z-score..................................................................................................................................................16
Value to Probability..............................................................................................................................16
Probability to Value..............................................................................................................................17
Probability Intervals..............................................................................................................................17
Z-Score to Z-Test...................................................................................................................................17
Z-Test....................................................................................................................................................17
Hypothesis Testing...............................................................................................................................18
Type-I and Type-II errors......................................................................................................................20
P-value..................................................................................................................................................20
t-Distribution........................................................................................................................................21
One-sample t-test.................................................................................................................................21
,Grasple summary
Two-sample t-test.................................................................................................................................22
Choosing a suitable Statistical Test.......................................................................................................23
Analysis Schema...................................................................................................................................24
Two-sample t-Test: Equal Variances.....................................................................................................24
, Grasple summary
Variables
Everything that is being measured, questioned, or kept a record of in research is contained in
variables. A variable can take on different values for different individuals, like age or gender.
Information is also called data. A dataset contains information about all participants and all variables.
A dataset looks like this: every row displays a participant. So the number of rows is equal to the
number of participants in the research. Every column displays a variable.
Measurement levels
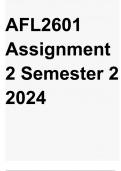
Suppose you have 12 buckets filled with several different colors of paint: 6 with red paint, 4 with
blue paint and 2 with green paint. What is the average color?
- Cannot be calculated
This is because there are different Levels of Measurement. The measurement level of the variable(s)
determines which statistical tools you can use. To pick the correct statistical tool, you need to
determine the measurement level of your variables. In this lesson you will be introduced to the four
measurement levels.
You can divide all variables into two groups:
- Categorical variables (measured in groups/categories)
o Nominal: based on a qualitative classification without any logical ranking.
An example of a nominal variable are colors, such as red, blue and green.
There is no inherent ranking in a list of different colors. Red, blue, green
contains the same information as blue, red, green.
o Ordinal: based on a qualitive classification with logical ranking.
An example of an ordinal variable are weather alarms. These often range
from none to yellow, orange and then red. There is an inherent ranking in
these different levels.
- Continuous variables (measured on a continuous scale)
o Interval: measured on a numerical scale, without an absolute zero value.
An example of an interval variable is sea level rise. The differences between
the values are meaningful for interval variables. For example, the difference
between 1 and 2 meters is the same as the difference between 2 and 3
meters. Interval variables do not have an absolute zero, even if the value is 0.
Negative sea level rise can also be recorded. Therefore, the value 0 is not an
absolute zero.
o Ratio: measured on a numerical scale, with an absolute zero value.
Examples of ratio variable are height and weight. A height or weight of zero
indicates that the object you are measuring does not have a height or a
weight. In fact, negative weight or length cannot be measured.
Furthermore, the differences between the different measurements are meaningful for both
ratio variables. For example, the difference between 1.30m and 1.40m is the same as the
difference between 1.40m and 1.50m. In addition, you can state that a 200m sprint is twice
as long as a 100m sprint.