Resumen
Summary "Linear Regression and HPLC Analysis in Pharmaceutical Research"
Puntuación
Vendido
-
Páginas
2
Subido en
13-02-2025
Escrito en
2024/2025
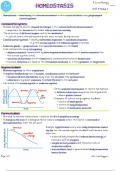
1. Image: The image contains an R script for performing a linear regression analysis using the ggplot2 and reshape2 libraries. The script creates a dataset with drug concentration and peak area, fits a linear regression model, and visualizes the relationship using a scatter plot with a regression line. Additionally, there is a mention of a hand-drawn plot related to pharmaceutical analysis using HPLC (High-Performance Liquid Chromatography). 2. File: I haven't opened the uploaded file yet. Let me know if you want me to read or analyze its contents.
Mostrar más
Leer menos
Institución
Grado
Ups! No podemos cargar tu documento ahora. Inténtalo de nuevo o contacta con soporte.
Escuela, estudio y materia
- Institución
- Escuela secundaria
- Computer
- Año escolar
- 4
Todos documentos para esta materia (260)
Información del documento
- Subido en
- 13 de febrero de 2025
- Número de páginas
- 2
- Escrito en
- 2024/2025
- Tipo
- Resumen
Temas
-
introduction to python
-
variables and datatypes
-
functions in python
$4.79
Accede al documento completo:
100% de satisfacción garantizada
Inmediatamente disponible después del pago
Tanto en línea como en PDF
No estas atado a nada
Conoce al vendedor
ahalsparkle