Nikita Sharma 2019W2 MATH 101 209
Assignment Homework 1 due 9/12/14 at 9pm
• 0.5*(6*1+31/4)
1. (1 point) • 3*1+2
(a) Estimate the area under the graph of f (x) = 3/x from • 0.5*(6*1+19/4)
x = 1 to x = 5 using four approximating rectangles and right • 3*1+11/4
endpoints. • 0.5*(6*1+47/8)
R4 = • E
(b) Repeat part (a) using left endpoints. 3. (1 point)
L4 = The speed of a runner increased during the first three seconds
(c) By looking at a sketch of the graph and the rectangles, of a race. Her speed at half-second intervals is given in the table.
determine for each estimate whether is overestimates, underes- Find the best possible lower and upper estimates for the distance
timates, or is the exact area. that she traveled during these three seconds. The answer to this
? 1. R4 problem requires that you enter the correct units.
? 2. L4
Correct Answers:
• 3*(1/2+1/3+1/4+1/5) t (s) 0 0.5 1.0 1.5 2.0 2.5 3.0
• 3*(1+1/2+1/3+1/4)
v ( f t/s) 0 5.5 10.6 15.1 17.1 19.5 20.4
• U
• O
2. (1 point)
(a) Estimate the area under the graph of f (x) = 1 + x2 from Lower estimate =
x = −1 to x = 2 using three approximating rectangles and right Upper estimate =
Correct Answers:
endpoints.
R3 = • 33.9 ft
(b) Repeat part (a) using six approximating rectangles and • 44.1 ft
right endpoints. 4. (1 point)
R6 = A table of values of an increasing function f is shown. Use
(c) Repeat part (a) using three approximating rectangles and the table to find lower and upper estimates for 025 f (x) dx.
R
left endpoints.
L3 = x 0 5 10 15 20 25
(d) Repeat part (a) using six approximating rectangles and f (x) −42 −37 −25 −6 15 36
left endpoints. Lower estimate =
L6 = Upper estimate =
(e) Repeat part (a) using three approximating rectangles and Correct Answers:
midpoints.
• -475
M3 = • -85
(f) Repeat part (a) using six approximating rectangles and
midpoints. 5. (1 point)
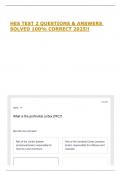
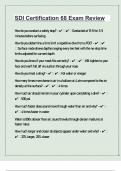
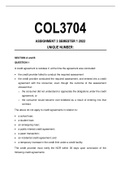
M6 = The velocity graph of a car accelerating from rest to a speed
Based on sketches of the graph of f (x) and the approximat- of 120 km/h over a period of 30 seconds is shown. Use the Mid-
ing rectangles, which appears to be the best estimate? point Rule with n = 6 to estimate the distance (in km) traveled
• A. M3 during this period.
• B. L3 Distance traveled ≈ km
• C. L6
• D. R3
• E. M6
• F. R6
Correct Answers:
Correct Answers:
• 1/720*(31.25+66+88+103.5+113.75+119.25)
• 3*1+5
1
Assignment Homework 1 due 9/12/14 at 9pm
• 0.5*(6*1+31/4)
1. (1 point) • 3*1+2
(a) Estimate the area under the graph of f (x) = 3/x from • 0.5*(6*1+19/4)
x = 1 to x = 5 using four approximating rectangles and right • 3*1+11/4
endpoints. • 0.5*(6*1+47/8)
R4 = • E
(b) Repeat part (a) using left endpoints. 3. (1 point)
L4 = The speed of a runner increased during the first three seconds
(c) By looking at a sketch of the graph and the rectangles, of a race. Her speed at half-second intervals is given in the table.
determine for each estimate whether is overestimates, underes- Find the best possible lower and upper estimates for the distance
timates, or is the exact area. that she traveled during these three seconds. The answer to this
? 1. R4 problem requires that you enter the correct units.
? 2. L4
Correct Answers:
• 3*(1/2+1/3+1/4+1/5) t (s) 0 0.5 1.0 1.5 2.0 2.5 3.0
• 3*(1+1/2+1/3+1/4)
v ( f t/s) 0 5.5 10.6 15.1 17.1 19.5 20.4
• U
• O
2. (1 point)
(a) Estimate the area under the graph of f (x) = 1 + x2 from Lower estimate =
x = −1 to x = 2 using three approximating rectangles and right Upper estimate =
Correct Answers:
endpoints.
R3 = • 33.9 ft
(b) Repeat part (a) using six approximating rectangles and • 44.1 ft
right endpoints. 4. (1 point)
R6 = A table of values of an increasing function f is shown. Use
(c) Repeat part (a) using three approximating rectangles and the table to find lower and upper estimates for 025 f (x) dx.
R
left endpoints.
L3 = x 0 5 10 15 20 25
(d) Repeat part (a) using six approximating rectangles and f (x) −42 −37 −25 −6 15 36
left endpoints. Lower estimate =
L6 = Upper estimate =
(e) Repeat part (a) using three approximating rectangles and Correct Answers:
midpoints.
• -475
M3 = • -85
(f) Repeat part (a) using six approximating rectangles and
midpoints. 5. (1 point)
M6 = The velocity graph of a car accelerating from rest to a speed
Based on sketches of the graph of f (x) and the approximat- of 120 km/h over a period of 30 seconds is shown. Use the Mid-
ing rectangles, which appears to be the best estimate? point Rule with n = 6 to estimate the distance (in km) traveled
• A. M3 during this period.
• B. L3 Distance traveled ≈ km
• C. L6
• D. R3
• E. M6
• F. R6
Correct Answers:
Correct Answers:
• 1/720*(31.25+66+88+103.5+113.75+119.25)
• 3*1+5
1