Brightspace filmpjes MMSR
Contents
Brightspace filmpjes MMSR....................................................................................................................1
Factor analysis (10-9)..........................................................................................................................2
Factor analysis video 1.1: introduction...........................................................................................2
Factor analysis video 1.2 – 1.5: conducting a factor analysis..........................................................2
AN(C)OVA (1-10).................................................................................................................................8
Introduction....................................................................................................................................8
Understanding the logic of ANCOVA/ANOVA..................................................................................9
Research process and application for One-way ANOVA................................................................10
N-way ANOVA...............................................................................................................................11
Assumptions & Interpretation of ANOVA / ANCOVA.....................................................................13
Regression Analysis (5-11)................................................................................................................17
Introduction..................................................................................................................................17
Process – Conducting a multiple regression analysis (MRA).........................................................18
Assumptions, estimation and model fit........................................................................................19
Issues in interpretation.................................................................................................................22
Moderating effects in MRA...........................................................................................................23
SEM with PLS (26-11)........................................................................................................................27
Introduction..................................................................................................................................27
Process of SEM.............................................................................................................................29
Assumptions and Requirements...................................................................................................31
Assessing measurement model....................................................................................................32
Assessing structural model...........................................................................................................35
1
,Factor analysis (10-9)
Factor analysis video 1.1: introduction
Factor analysis = estimate a model which explains variance/covariance between a set of observed
variables (in a population) by a set of (fewer) unobserved factors & weightings.
- Observed variables – survey, media. You want to understand the set between the observed
variables.
Main purpose of factor analysis is data reduction and summarization, so we want to reduce our
data and use it in other analysis like regression analysis, and these are the 3 ways to do it.
What is factor analysis?
- Interdependence technique
- Define structure among variables
- Interrelationships among large number of variables to identify underlying dimensions
(factors)
- Data summarization and reduction
Multi-item measurement
- Increases reliability and validity of measures
- Allows measurement assessment
o Measurement error
o Reliability
o Validity
- Two forms of measurement models:
o Formative (emerging) & Reflective (latent)
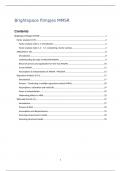
Reflective measurement model
- Direction of causality is from construct to measure
- Correlated indicators
- Takes measurement error into account at the item level
- Validity of items is usually tested with factor analysis
Picture right is the construct. We want to assess the factor loading to
each item which is noted with labda and we are also interested in the measurement error.
groen – variable?
donker blauw – labda (factor loading)
rood – construct
licht blauw – measurement error
Factor analysis video 1.2 – 1.5: conducting a factor analysis
Process for factor analysis/ analysis process:
- Problem formulation
- Construction correlation matrix of data we have collected
- Selecting extraction method
- Determining number of factors
2
, - Rotating the factors
- Interpreting factors
- Using factors in other analyses
- Determining the model fit
1. Problem formulation
The objectives of factor analysis should be identified data summarization or data reduction.
The problem formulation shows which variables we are going to measure. Criteria:
- based on past research, theory, and judgment of the researcher
- Measurement properties (ratio, interval)
- Sample size (4-5 * N per variable) (important)
Distinguish between exploratory factor analyses and confirmatory factor analyses:
- exploratory factor analyses: about exploration of the data.
o So interested in finding an underlying structure.
o Assumptions that superior factors cause correlations between variables.
o Reveal interrelationships
o Generation of hypotheses
- Confirmatory factor analyses:
o A priori ideas of underlying factors, derived from theory.
o Relationships between variables and factors are often conducted before the factor
analysis
o So it is often used for testing of hypotheses.
2. Construction correlation matrix of data we have collected
Factor analysis is - Analytical process is based on a matrix of correlations between the
variables. And thus we make a construction correlation matrix. Useful statistics:
- Kaiser-Meyer-Olkin (KMO) it tells you whether your sample adequately represents the
population. Should be above 0.5. the closer to 1 the better!
- Bartlett's test of sphericity: test the null hypothesis that the variables are uncorrelated in
the population. If the 0 hypotheses has to be accepted that means that no correlation has to
be existing in the population and then you wouldn’t be able to do factor analysis and thus is
this not what you often do and you want to reject the 0 hypotheses.
Bartlett should be significant and bartletts significant level should be smaller than 0.05.
3. Selecting an extraction method
Very important step. We have 2 types:
- Principal components analysis
o Looks at the total variance in the data
o Within the correlation matrix the Diagonal of the correlation matrix consists of
unities.
o Full variance is brought into the factor analysis
o Primary concern: minimum numbers of factors that will account for maximum
variance. Tries to maximize explained variance.
o The factors are called – principal components.
o Each variable is expressed as a linear combination of the components.
o The covariation among variables is described in terms of a small number of principal
components.
3
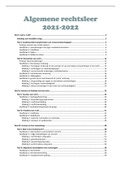
, - Common factor analysis
o Factors are estimated based only on the common variance
o Communalities (sharing interests) are inserted in the diagonal of the correlation
matrix
o Primary concern: identify the underlying dimensions and their common variance
o Also known as- > principal axis factoring
o Each variable is expressed as a linear combination of underlying factors.
o The covariation among the variables is described in terms of a small number of
common factors plus a unique factor for each variable.
Red – variance is extracted
White – variance is excluded (the unique
variance is excluded within the
communality)
Blue – principal model
Green – common factor
4
Contents
Brightspace filmpjes MMSR....................................................................................................................1
Factor analysis (10-9)..........................................................................................................................2
Factor analysis video 1.1: introduction...........................................................................................2
Factor analysis video 1.2 – 1.5: conducting a factor analysis..........................................................2
AN(C)OVA (1-10).................................................................................................................................8
Introduction....................................................................................................................................8
Understanding the logic of ANCOVA/ANOVA..................................................................................9
Research process and application for One-way ANOVA................................................................10
N-way ANOVA...............................................................................................................................11
Assumptions & Interpretation of ANOVA / ANCOVA.....................................................................13
Regression Analysis (5-11)................................................................................................................17
Introduction..................................................................................................................................17
Process – Conducting a multiple regression analysis (MRA).........................................................18
Assumptions, estimation and model fit........................................................................................19
Issues in interpretation.................................................................................................................22
Moderating effects in MRA...........................................................................................................23
SEM with PLS (26-11)........................................................................................................................27
Introduction..................................................................................................................................27
Process of SEM.............................................................................................................................29
Assumptions and Requirements...................................................................................................31
Assessing measurement model....................................................................................................32
Assessing structural model...........................................................................................................35
1
,Factor analysis (10-9)
Factor analysis video 1.1: introduction
Factor analysis = estimate a model which explains variance/covariance between a set of observed
variables (in a population) by a set of (fewer) unobserved factors & weightings.
- Observed variables – survey, media. You want to understand the set between the observed
variables.
Main purpose of factor analysis is data reduction and summarization, so we want to reduce our
data and use it in other analysis like regression analysis, and these are the 3 ways to do it.
What is factor analysis?
- Interdependence technique
- Define structure among variables
- Interrelationships among large number of variables to identify underlying dimensions
(factors)
- Data summarization and reduction
Multi-item measurement
- Increases reliability and validity of measures
- Allows measurement assessment
o Measurement error
o Reliability
o Validity
- Two forms of measurement models:
o Formative (emerging) & Reflective (latent)
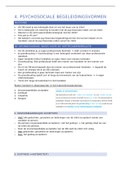
Reflective measurement model
- Direction of causality is from construct to measure
- Correlated indicators
- Takes measurement error into account at the item level
- Validity of items is usually tested with factor analysis
Picture right is the construct. We want to assess the factor loading to
each item which is noted with labda and we are also interested in the measurement error.
groen – variable?
donker blauw – labda (factor loading)
rood – construct
licht blauw – measurement error
Factor analysis video 1.2 – 1.5: conducting a factor analysis
Process for factor analysis/ analysis process:
- Problem formulation
- Construction correlation matrix of data we have collected
- Selecting extraction method
- Determining number of factors
2
, - Rotating the factors
- Interpreting factors
- Using factors in other analyses
- Determining the model fit
1. Problem formulation
The objectives of factor analysis should be identified data summarization or data reduction.
The problem formulation shows which variables we are going to measure. Criteria:
- based on past research, theory, and judgment of the researcher
- Measurement properties (ratio, interval)
- Sample size (4-5 * N per variable) (important)
Distinguish between exploratory factor analyses and confirmatory factor analyses:
- exploratory factor analyses: about exploration of the data.
o So interested in finding an underlying structure.
o Assumptions that superior factors cause correlations between variables.
o Reveal interrelationships
o Generation of hypotheses
- Confirmatory factor analyses:
o A priori ideas of underlying factors, derived from theory.
o Relationships between variables and factors are often conducted before the factor
analysis
o So it is often used for testing of hypotheses.
2. Construction correlation matrix of data we have collected
Factor analysis is - Analytical process is based on a matrix of correlations between the
variables. And thus we make a construction correlation matrix. Useful statistics:
- Kaiser-Meyer-Olkin (KMO) it tells you whether your sample adequately represents the
population. Should be above 0.5. the closer to 1 the better!
- Bartlett's test of sphericity: test the null hypothesis that the variables are uncorrelated in
the population. If the 0 hypotheses has to be accepted that means that no correlation has to
be existing in the population and then you wouldn’t be able to do factor analysis and thus is
this not what you often do and you want to reject the 0 hypotheses.
Bartlett should be significant and bartletts significant level should be smaller than 0.05.
3. Selecting an extraction method
Very important step. We have 2 types:
- Principal components analysis
o Looks at the total variance in the data
o Within the correlation matrix the Diagonal of the correlation matrix consists of
unities.
o Full variance is brought into the factor analysis
o Primary concern: minimum numbers of factors that will account for maximum
variance. Tries to maximize explained variance.
o The factors are called – principal components.
o Each variable is expressed as a linear combination of the components.
o The covariation among variables is described in terms of a small number of principal
components.
3
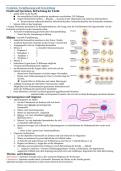
, - Common factor analysis
o Factors are estimated based only on the common variance
o Communalities (sharing interests) are inserted in the diagonal of the correlation
matrix
o Primary concern: identify the underlying dimensions and their common variance
o Also known as- > principal axis factoring
o Each variable is expressed as a linear combination of underlying factors.
o The covariation among the variables is described in terms of a small number of
common factors plus a unique factor for each variable.
Red – variance is extracted
White – variance is excluded (the unique
variance is excluded within the
communality)
Blue – principal model
Green – common factor
4