Week 2
Practicum Project: Health Promotion Data
Collection and Analysis Template
Name: Marissa Fagundes Date: 9/13/2024
Part 1: Demographic Data Collection
Directions:
1. Access the U.S. Census Bureau Quick Fact.
https://www.census.gov/quickfacts/fact/table/US/PST0
45218
2. U.S. data will automatically populate. Locate the U.S. demographic data to
complete all sections of the table below.
3. At the top of the U.S. Census Bureau website, enter your zip code or
county/township name. The data will populate. Locate the related
demographic data to complete all sections of the table below.
4. At the topic of the U.S. Census Bureau website, enter your state. The data
will populate. Locate the related demographic data to complete all sections
of the table below.
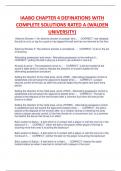
Demographic Data County Data State Data U.S. Data
Population total 20,469 7,001,399 334,914,895
Male (subtract 47.4% 48.9% 49.5%
female
% from 100)
Female 52.6% 51.1% 50.5%
Persons under 5 3.1% 4.9% 5.5%
Persons over 65 26.5% 51.1% 50.5%
Race and Origin
County Data State Data U.S. Data
White alone 93.7% 79.0% 73.5%
Black or African 1.2% 9.6% 13.7%
American alone
American Indian and 0.2% 0.6% 1.3%
Alaska Native alone
Asian alone 1.4% 7.9% 6.4%
© 2023. Chamberlain University LLC. All rights reserved.
1
6.13.23
, Native Hawaiian and 0.0% 0.1% 0.3%
other Pacific Islander
alone
Two or more races 2.9% 2.8% 3.1%
Hispanic or Latino 2.1% 13.5% 19.5%
White alone, not 92.0% 68.8% 58.4%
Hispanic or Latino
Significant Population Characteristics
County Data State Data U.S. Data
Veterans 1,286 266,304 17,038,807
Foreign born 4.1% 17.6% 13.7%
persons
Housing Overview
County Data State Data U.S. Data
Housing units X – N/A 3,045,948 145,344,626
Owner-occupied 88.9% 62.4% 64.8%
housing unit rate
Median selected $2,514 $2,553 $1,828
monthly owner costs
with a mortgage
Median selected $951 $957 $584
monthly owner costs
without a mortgage
Median value of $482,300 $483,900 $281,900
owner-occupied
housing units
Median gross rent $1,652 $1,588 $1,268
Family and Living Arrangements
County Data State Data U.S. Data
Households 7,977 2,470,995 125,736,353
Persons per 2.54 2.46 2.57
household
Language other than 4.8% 24.5% 21.7%
English spoken at
home
Computer and Internet Use
County Data State Data U.S. Data
Households with a 97.1% 94.3% 94.0%
© 2023. Chamberlain University LLC. All rights reserved.
2
6.13.23
Practicum Project: Health Promotion Data
Collection and Analysis Template
Name: Marissa Fagundes Date: 9/13/2024
Part 1: Demographic Data Collection
Directions:
1. Access the U.S. Census Bureau Quick Fact.
https://www.census.gov/quickfacts/fact/table/US/PST0
45218
2. U.S. data will automatically populate. Locate the U.S. demographic data to
complete all sections of the table below.
3. At the top of the U.S. Census Bureau website, enter your zip code or
county/township name. The data will populate. Locate the related
demographic data to complete all sections of the table below.
4. At the topic of the U.S. Census Bureau website, enter your state. The data
will populate. Locate the related demographic data to complete all sections
of the table below.
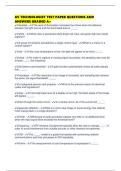
Demographic Data County Data State Data U.S. Data
Population total 20,469 7,001,399 334,914,895
Male (subtract 47.4% 48.9% 49.5%
female
% from 100)
Female 52.6% 51.1% 50.5%
Persons under 5 3.1% 4.9% 5.5%
Persons over 65 26.5% 51.1% 50.5%
Race and Origin
County Data State Data U.S. Data
White alone 93.7% 79.0% 73.5%
Black or African 1.2% 9.6% 13.7%
American alone
American Indian and 0.2% 0.6% 1.3%
Alaska Native alone
Asian alone 1.4% 7.9% 6.4%
© 2023. Chamberlain University LLC. All rights reserved.
1
6.13.23
, Native Hawaiian and 0.0% 0.1% 0.3%
other Pacific Islander
alone
Two or more races 2.9% 2.8% 3.1%
Hispanic or Latino 2.1% 13.5% 19.5%
White alone, not 92.0% 68.8% 58.4%
Hispanic or Latino
Significant Population Characteristics
County Data State Data U.S. Data
Veterans 1,286 266,304 17,038,807
Foreign born 4.1% 17.6% 13.7%
persons
Housing Overview
County Data State Data U.S. Data
Housing units X – N/A 3,045,948 145,344,626
Owner-occupied 88.9% 62.4% 64.8%
housing unit rate
Median selected $2,514 $2,553 $1,828
monthly owner costs
with a mortgage
Median selected $951 $957 $584
monthly owner costs
without a mortgage
Median value of $482,300 $483,900 $281,900
owner-occupied
housing units
Median gross rent $1,652 $1,588 $1,268
Family and Living Arrangements
County Data State Data U.S. Data
Households 7,977 2,470,995 125,736,353
Persons per 2.54 2.46 2.57
household
Language other than 4.8% 24.5% 21.7%
English spoken at
home
Computer and Internet Use
County Data State Data U.S. Data
Households with a 97.1% 94.3% 94.0%
© 2023. Chamberlain University LLC. All rights reserved.
2
6.13.23