Statistical Methods - Summary
Lecture 1
● Statistics: science of data, the study of collecting, organizing, analyzing, interpreting and
presenting data.
○ Statistics are used to gain information about a group of objects (population)
and/or to make decisions and predictions when randomness is involved.
● Census: collection of data from every member of a population.
○ Usually too large to collect
○ Therefore, a sample, a selected subcollection (or subset) from the population is
studied.
■ A different sample results in different data. Hence, possibly different
conclusions about the population. A sample should be representative
(same characteristics as population) and unbiased (no systematic
difference with population)
○ Sample → Data → Analysis → Conclusion about population
1.2 Statistical and critical thinking
● A statistical study consists of the following steps:
1. Prepare
a. Context
b. Source
c. Sampling method (how to obtain samples?)
2. Analyse
a. Graph data
b. Explore data
c. Apply statistical methods
3. Conclude
1.4 Collecting sample data:
● There are different methods to collect sample data
○ Voluntary response sample: subjects decide themselves to be included in the
sample.
○ Random sample: each member of the population has equal probability of being
selected.
○ Simple random sample: each sample of size n has equal probability of being
chosen.
○ Systematic sampling: after starting point, select every k-th member.
○ Convenience sampling: easily available results.
○ Stratified sampling: divide population into subgroups (strata) such that subjects
within groups have the same characteristics, then draw a (simple) random sample
from each group.
1
,Statistical Methods - Summary
○ Cluster sampling: Divide population into sections (clusters), then randomly
select some of these clusters.
● Important concepts:
○ Variable: quantity that may vary
● In cause and effect studies:
○ Explanatory (independent) variable: variable which might cause the effect
being studied.
○ Response (dependent) variable: variable that represents the effect being studied.
○ Confounding: occurs when influences of different explanatory variables on
response variable mix and can not be distinguished anymore.
● Different types of study:
○ Observational study: characteristics of subjects are observed, but subjects are
not modified.
■ Retrospective (case-control): data from the past
■ Cross-sectional: data from one point in time
■ Prospective (longitudinal): data to be collected
○ Experiment: some treatment is applied to subjects.
■ Sometimes control and treatment group: single-blind and double-blind.
■ Placebo effect, experimenter effect.
1.3 Types of data
● Parameter: numerical measurement describing some characteristic of a population.
○ Notation: typically Greek symbols, e.g. μ, σ,....
● Statistic: numerical measurement describing some characteristic of a sample.
○ Notation: small letters, e.g. ̄x, s.
● Data is not only numbers
○ Quantitative (numerical) data: numbers representing counts or measurements
■ E.g., number of students’ siblings: 1, 0, 2, 2, 5...
○ Qualitative (categorical) data: names or labels (“1”, not 1) representing counts
or measurements
■ E.g., quality of a course: good/far/bad
● Quantitative data:
○ Discrete data: number of possible values is “countable”
■ E.g., word counts, number of coin tosses
○ Continuous data: collection of values is not countable
■ E.g., length, weight, distance
● Level of measurement of data is used to determine which statistical methods might apply
to the data.
2
,Statistical Methods - Summary
○ Qualitative data:
■ Nominal: names, labels, categories (no ordering).
● E.g. gender, eye color. Can not be used for computations.
■ Ordinal: categories with ordering, but no (meaningful) differences.
● E.g. U.S. grades (A-F), opinions (totally disagree / disagree / . . . /
totally agree)
○ Quantitative data:
■ Interval: ordering possible and differences between numbers are
meaningful, but there is no natural zero starting point.
● E.g. year of birth, temperatures (Celsius/Fahrenheit).
■ Ratio: ordering possible, differences are meaningful and there is a natural
starting point.
● E.g. body length, marathon times
● Determine the level of measurement for the following data:
○ M&M colours = nominal data (qualitative, no ordering)
○ Inauguration years of U.S. presidents = interval data (quantitative, no natural
starting point)
○ Brain volumes (in cm3) = ratio data (quantitative, natural starting point)
○ Level of lead in blood (low/medium/high) = ordinal data (qualitative, ordering)
Summarizing and graphing data
● From now on,we assume that data are from a representative and unbiased sample.
● Next: summarize data
○ Numerical summary
○ Graphical summary
● Every data set comes with a research question. Use your summary to answer your
research question.
● Typically we are interested in the data distribution — where does the data lie?
● Good summary shows:
○ what the data distribution looks like: location, spread/dispersion, range,extremes,
accumulations, gaps/holes, symmetry, . . .
● Depending on context and goal, also whether:
○ data could be sampled from a certain distribution
○ data is rounded
○ different groups are needed for further analysis
○ there are influences of other variables, e.g. time
○ there is dependence between variables.
● Summarise to describe or find structure in data distribution:
○ Graphical: tables, graphs, other figures of data distribution
3
, Statistical Methods - Summary
○ Descriptive
■ Qualitative: describe shape, location and dispersion/variation of data
distribution
■ Quantitative: numerical summaries of location and variation
○ NB: first step in every data analysis: make some figures of data (if possible) for
own use. Could prevent wrong choice of statistical methods.
Graphical summaries
→ Some of these summaries can only be used for some types of data.
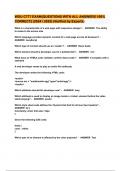
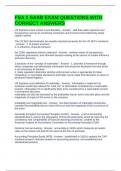
● Frequency distribution (table)
○ Count occurrences of category or number of values in interval
○ freq=cbind(table(grades2[,2]))
freq=cbind(freq[,1],cumsum(freq[,1]),freq[,1]/length(grades),cumsum(freq[,1])/length(grades))
colnames(freq)=c("Frequency","Cumulative","Rel. frequency","Cum. rel. frequency")
options(digits=2)
print(freq)
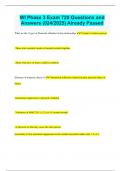
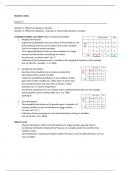
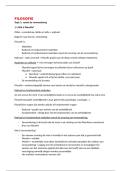
● Bar chart
○ population=c(322,1372,147,127,65,81,1278,36,407,1111)
names(population)=c("US", "Chi", "Rus", "Jap", "GB",
"Ger", "Ind", "Can", "SAm","Afr")
par(mfrow=c(1,1))
barplot(population,main="Bar chart", ylab="Pop. size (mln)",col="red")
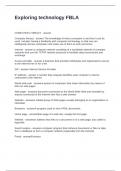
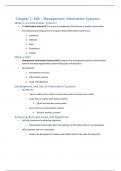
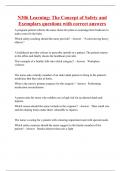
● Pareto bar chart
○ orders the categories with respect to frequency. Only applies to data of nominal
level of measurement.
par(mfrow=c(1,1))
barplot(sort(population,decreasing = TRUE), main="Pareto bar chart", ylab="Pop. size (mln)", col="blue")
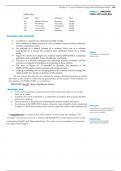
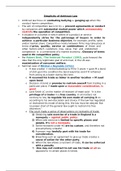
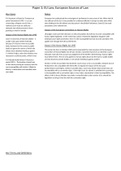
● Pie chart
○ Size of pieces of pie is determined by relative frequency of
category. Mainly used for qualitative data.
○ pie(population/sum(population), col=c("green", "yellow" , "brown",
"blue","red", "grey","purple", "orange", "pink", "black"))
4
Lecture 1
● Statistics: science of data, the study of collecting, organizing, analyzing, interpreting and
presenting data.
○ Statistics are used to gain information about a group of objects (population)
and/or to make decisions and predictions when randomness is involved.
● Census: collection of data from every member of a population.
○ Usually too large to collect
○ Therefore, a sample, a selected subcollection (or subset) from the population is
studied.
■ A different sample results in different data. Hence, possibly different
conclusions about the population. A sample should be representative
(same characteristics as population) and unbiased (no systematic
difference with population)
○ Sample → Data → Analysis → Conclusion about population
1.2 Statistical and critical thinking
● A statistical study consists of the following steps:
1. Prepare
a. Context
b. Source
c. Sampling method (how to obtain samples?)
2. Analyse
a. Graph data
b. Explore data
c. Apply statistical methods
3. Conclude
1.4 Collecting sample data:
● There are different methods to collect sample data
○ Voluntary response sample: subjects decide themselves to be included in the
sample.
○ Random sample: each member of the population has equal probability of being
selected.
○ Simple random sample: each sample of size n has equal probability of being
chosen.
○ Systematic sampling: after starting point, select every k-th member.
○ Convenience sampling: easily available results.
○ Stratified sampling: divide population into subgroups (strata) such that subjects
within groups have the same characteristics, then draw a (simple) random sample
from each group.
1
,Statistical Methods - Summary
○ Cluster sampling: Divide population into sections (clusters), then randomly
select some of these clusters.
● Important concepts:
○ Variable: quantity that may vary
● In cause and effect studies:
○ Explanatory (independent) variable: variable which might cause the effect
being studied.
○ Response (dependent) variable: variable that represents the effect being studied.
○ Confounding: occurs when influences of different explanatory variables on
response variable mix and can not be distinguished anymore.
● Different types of study:
○ Observational study: characteristics of subjects are observed, but subjects are
not modified.
■ Retrospective (case-control): data from the past
■ Cross-sectional: data from one point in time
■ Prospective (longitudinal): data to be collected
○ Experiment: some treatment is applied to subjects.
■ Sometimes control and treatment group: single-blind and double-blind.
■ Placebo effect, experimenter effect.
1.3 Types of data
● Parameter: numerical measurement describing some characteristic of a population.
○ Notation: typically Greek symbols, e.g. μ, σ,....
● Statistic: numerical measurement describing some characteristic of a sample.
○ Notation: small letters, e.g. ̄x, s.
● Data is not only numbers
○ Quantitative (numerical) data: numbers representing counts or measurements
■ E.g., number of students’ siblings: 1, 0, 2, 2, 5...
○ Qualitative (categorical) data: names or labels (“1”, not 1) representing counts
or measurements
■ E.g., quality of a course: good/far/bad
● Quantitative data:
○ Discrete data: number of possible values is “countable”
■ E.g., word counts, number of coin tosses
○ Continuous data: collection of values is not countable
■ E.g., length, weight, distance
● Level of measurement of data is used to determine which statistical methods might apply
to the data.
2
,Statistical Methods - Summary
○ Qualitative data:
■ Nominal: names, labels, categories (no ordering).
● E.g. gender, eye color. Can not be used for computations.
■ Ordinal: categories with ordering, but no (meaningful) differences.
● E.g. U.S. grades (A-F), opinions (totally disagree / disagree / . . . /
totally agree)
○ Quantitative data:
■ Interval: ordering possible and differences between numbers are
meaningful, but there is no natural zero starting point.
● E.g. year of birth, temperatures (Celsius/Fahrenheit).
■ Ratio: ordering possible, differences are meaningful and there is a natural
starting point.
● E.g. body length, marathon times
● Determine the level of measurement for the following data:
○ M&M colours = nominal data (qualitative, no ordering)
○ Inauguration years of U.S. presidents = interval data (quantitative, no natural
starting point)
○ Brain volumes (in cm3) = ratio data (quantitative, natural starting point)
○ Level of lead in blood (low/medium/high) = ordinal data (qualitative, ordering)
Summarizing and graphing data
● From now on,we assume that data are from a representative and unbiased sample.
● Next: summarize data
○ Numerical summary
○ Graphical summary
● Every data set comes with a research question. Use your summary to answer your
research question.
● Typically we are interested in the data distribution — where does the data lie?
● Good summary shows:
○ what the data distribution looks like: location, spread/dispersion, range,extremes,
accumulations, gaps/holes, symmetry, . . .
● Depending on context and goal, also whether:
○ data could be sampled from a certain distribution
○ data is rounded
○ different groups are needed for further analysis
○ there are influences of other variables, e.g. time
○ there is dependence between variables.
● Summarise to describe or find structure in data distribution:
○ Graphical: tables, graphs, other figures of data distribution
3
, Statistical Methods - Summary
○ Descriptive
■ Qualitative: describe shape, location and dispersion/variation of data
distribution
■ Quantitative: numerical summaries of location and variation
○ NB: first step in every data analysis: make some figures of data (if possible) for
own use. Could prevent wrong choice of statistical methods.
Graphical summaries
→ Some of these summaries can only be used for some types of data.
● Frequency distribution (table)
○ Count occurrences of category or number of values in interval
○ freq=cbind(table(grades2[,2]))
freq=cbind(freq[,1],cumsum(freq[,1]),freq[,1]/length(grades),cumsum(freq[,1])/length(grades))
colnames(freq)=c("Frequency","Cumulative","Rel. frequency","Cum. rel. frequency")
options(digits=2)
print(freq)
● Bar chart
○ population=c(322,1372,147,127,65,81,1278,36,407,1111)
names(population)=c("US", "Chi", "Rus", "Jap", "GB",
"Ger", "Ind", "Can", "SAm","Afr")
par(mfrow=c(1,1))
barplot(population,main="Bar chart", ylab="Pop. size (mln)",col="red")
● Pareto bar chart
○ orders the categories with respect to frequency. Only applies to data of nominal
level of measurement.
par(mfrow=c(1,1))
barplot(sort(population,decreasing = TRUE), main="Pareto bar chart", ylab="Pop. size (mln)", col="blue")
● Pie chart
○ Size of pieces of pie is determined by relative frequency of
category. Mainly used for qualitative data.
○ pie(population/sum(population), col=c("green", "yellow" , "brown",
"blue","red", "grey","purple", "orange", "pink", "black"))
4