Appendix 13
A13.1 Equal-variances t-test of μ1 − μ 2
H 0 : (μ1 − μ 2 ) = 0
H 1 : (μ1 − μ 2 ) < 0
( x 1 − x 2 ) − (μ 1 − μ 2 )
t=
⎛ 1 1 ⎞
s 2p ⎜⎜ + ⎟⎟
⎝ n1 n 2 ⎠
A B C
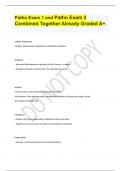
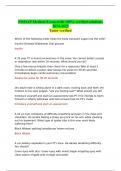
1 t-Test: Two-Sample Assuming Equal Variances
2
3 This Year 3 Years Ago
4 Mean 8.29 10.36
5 Variance 8.13 8.43
6 Observations 100 100
7 Pooled Variance 8.28
8 Hypothesized Mean Difference 0
9 df 198
10 t Stat -5.09
11 P(T<=t) one-tail 0.0000
12 t Critical one-tail 1.6526
13 P(T<=t) two-tail 0.0000
14 t Critical two-tail 1.9720
t = –5.09, p-value = 0. There is overwhelming evidence to conclude that there has been a decrease over the past
three years.
A13.2 a z-test of p1 − p 2 (case 1)
H 0 : (p1 − p 2 ) = 0
H1 : (p1 − p 2 ) > 0
(p̂ 1 − p̂ 2 )
z=
⎛ 1 1 ⎞
p̂(1 − p̂)⎜⎜ + ⎟⎟
n
⎝ 1 n 2 ⎠
A B C D E
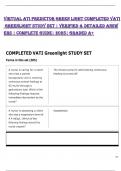
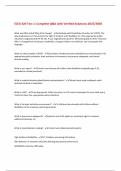
1 z-Test of the Difference Between Two Proportions (Case 1)
2
3 Sample 1 Sample 2 z Stat 2.83
4 Sample proportion 0.4336 0.2414 P(Z<=z) one-tail 0.0024
5 Sample size 113 87 z Critical one-tail 1.6449
6 Alpha 0.05 P(Z<=z) two-tail 0.0047
7 z Critical two-tail 1.9600
331
This edition is intended for use outside of the U.S. only, with content that may be different from the U.S. Edition. This may not be resold, copied,
or distributed without the prior consent of the publisher.
,z = 2.83, p-value = .0024. There is enough evidence to infer that customers who see the ad are more likely to make a
purchase than those who do not see the ad.
b Equal-variances t-test of μ 1 − μ 2
H 0 : (μ 1 − μ 2 ) = 0
H 1 : (μ 1 − μ 2 ) > 0
( x 1 − x 2 ) − (μ 1 − μ 2 )
t=
⎛ 1 1 ⎞
s 2p ⎜⎜ + ⎟⎟
⎝ n1 n 2 ⎠
A B C
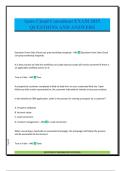
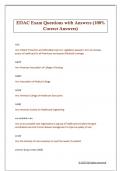
1 t-Test: Two-Sample Assuming Equal Variances
2
3 Ad No Ad
4 Mean 97.38 92.01
5 Variance 621.97 283.26
6 Observations 49 21
7 Pooled Variance 522.35
8 Hypothesized Mean Difference 0
9 df 68
10 t Stat 0.90
11 P(T<=t) one-tail 0.1853
12 t Critical one-tail 1.6676
13 P(T<=t) two-tail 0.3705
14 t Critical two-tail 1.9955
t = .90, p-value = .1853. There is not enough evidence to infer that customers who see the ad and make a purchase
spend more than those who do not see the ad and make a purchase.
c z-estimator of p
p̂(1 − p̂)
p̂ ± z α / 2
n
A B C D E
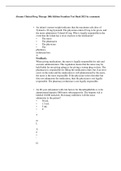
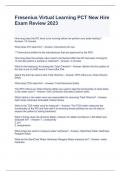
1 z-Estimate of a Proportion
2
3 Sample proportion 0.4336 Confidence Interval Estimate
4 Sample size 113 0.4336 ± 0.0914
5 Confidence level 0.95 Lower confidence limit 0.3423
6 Upper confidence limit 0.5250
We estimate that between 34.23% and 52.50% of all customers who see the ad will make a purchase.
d t-estimator of μ
s
x ± tα/2
n
332
This edition is intended for use outside of the U.S. only, with content that may be different from the U.S. Edition. This may not be resold, copied,
or distributed without the prior consent of the publisher.
, A B C D
1 t-Estimate: Mean
2
3 Ad
4 Mean 97.38
5 Standard Deviation 24.94
6 LCL 90.22
7 UCL 104.55
We estimate that the mean amount spent by customers who see the ad and make a purchase lies between $90.22 and
$104.55.
A13.3 t-test of μ D
H0 :μD = 0
H1 : μ D > 0
xD −μD
t=
sD / n D
A B C
1 t-Test: Paired Two Sample for Means
2
3 Before After
4 Mean 381.00 373.12
5 Variance 39001 40663
6 Observations 25 25
7 Pearson Correlation 0.96
8 Hypothesized Mean Difference 0
9 df 24
10 t Stat 0.70
11 P(T<=t) one-tail 0.2438
12 t Critical one-tail 1.7109
13 P(T<=t) two-tail 0.4876
14 t Critical two-tail 2.0639
t = .70, p-value = .2438. There is not enough evidence to conclude that the equipment is effective.
A13.4 Frequency of accidents: z -test of p1 − p 2 (case 1)
H 0 : (p1 − p 2 ) = 0
H1 : (p1 − p 2 ) > 0
(p̂ 1 − p̂ 2 )
z=
⎛ 1 1 ⎞
p̂(1 − p̂)⎜⎜ + ⎟⎟
n
⎝ 1 n 2 ⎠
333
This edition is intended for use outside of the U.S. only, with content that may be different from the U.S. Edition. This may not be resold, copied,
or distributed without the prior consent of the publisher.
, A B C D E
1 z-Test of the Difference Between Two Proportions (Case 1)
2
3 Sample 1 Sample 2 z Stat 0.47
4 Sample proportion 0.0840 0.0760 P(Z<=z) one-tail 0.3205
5 Sample size 500 500 z Critical one-tail 1.6449
6 Alpha 0.05 P(Z<=z) two-tail 0.6410
7 z Critical two-tail 1.9600
z = .47, p-value = .32053. There is not enough evidence to infer that ABS-equipped cars have fewer accidents than
cars without ABS.
Severity of accidents Equal-variances t-test of μ 1 − μ 2
H 0 : (μ 1 − μ 2 ) = 0
H 1 : (μ 1 − μ 2 ) > 0
( x 1 − x 2 ) − (μ 1 − μ 2 )
t=
⎛ 1 1 ⎞
s 2p ⎜⎜ + ⎟⎟
n
⎝ 1 n 2 ⎠
A B C
1 t-Test: Two-Sample Assuming Equal Variances
2
3 No ABS ABS
4 Mean 2075 1714
5 Variance 450,343 390,409
6 Observations 42 38
7 Pooled Variance 421,913
8 Hypothesized Mean Difference 0
9 df 78
10 t Stat 2
11 P(T<=t) one-tail 0.0077
12 t Critical one-tail 1.6646
13 P(T<=t) two-tail 0.0153
14 t Critical two-tail 1.9908
Estimate of the difference between two means (equal-variances)
A B C D E F
1 t-Estimate of the Difference Between Two Means (Equal-Variances)
2
3 Sample 1 Sample 2 Confidence Interval Estimate
4 Mean 2075 1714 360.48 ± 290
5 Variance 450,343 390,409 Lower confidence limit 71
6 Sample size 42 38 Upper confidence limit 650
7 Pooled Variance 421,913
8 Confidence level 0.95
334
This edition is intended for use outside of the U.S. only, with content that may be different from the U.S. Edition. This may not be resold, copied,
or distributed without the prior consent of the publisher.
A13.1 Equal-variances t-test of μ1 − μ 2
H 0 : (μ1 − μ 2 ) = 0
H 1 : (μ1 − μ 2 ) < 0
( x 1 − x 2 ) − (μ 1 − μ 2 )
t=
⎛ 1 1 ⎞
s 2p ⎜⎜ + ⎟⎟
⎝ n1 n 2 ⎠
A B C
1 t-Test: Two-Sample Assuming Equal Variances
2
3 This Year 3 Years Ago
4 Mean 8.29 10.36
5 Variance 8.13 8.43
6 Observations 100 100
7 Pooled Variance 8.28
8 Hypothesized Mean Difference 0
9 df 198
10 t Stat -5.09
11 P(T<=t) one-tail 0.0000
12 t Critical one-tail 1.6526
13 P(T<=t) two-tail 0.0000
14 t Critical two-tail 1.9720
t = –5.09, p-value = 0. There is overwhelming evidence to conclude that there has been a decrease over the past
three years.
A13.2 a z-test of p1 − p 2 (case 1)
H 0 : (p1 − p 2 ) = 0
H1 : (p1 − p 2 ) > 0
(p̂ 1 − p̂ 2 )
z=
⎛ 1 1 ⎞
p̂(1 − p̂)⎜⎜ + ⎟⎟
n
⎝ 1 n 2 ⎠
A B C D E
1 z-Test of the Difference Between Two Proportions (Case 1)
2
3 Sample 1 Sample 2 z Stat 2.83
4 Sample proportion 0.4336 0.2414 P(Z<=z) one-tail 0.0024
5 Sample size 113 87 z Critical one-tail 1.6449
6 Alpha 0.05 P(Z<=z) two-tail 0.0047
7 z Critical two-tail 1.9600
331
This edition is intended for use outside of the U.S. only, with content that may be different from the U.S. Edition. This may not be resold, copied,
or distributed without the prior consent of the publisher.
,z = 2.83, p-value = .0024. There is enough evidence to infer that customers who see the ad are more likely to make a
purchase than those who do not see the ad.
b Equal-variances t-test of μ 1 − μ 2
H 0 : (μ 1 − μ 2 ) = 0
H 1 : (μ 1 − μ 2 ) > 0
( x 1 − x 2 ) − (μ 1 − μ 2 )
t=
⎛ 1 1 ⎞
s 2p ⎜⎜ + ⎟⎟
⎝ n1 n 2 ⎠
A B C
1 t-Test: Two-Sample Assuming Equal Variances
2
3 Ad No Ad
4 Mean 97.38 92.01
5 Variance 621.97 283.26
6 Observations 49 21
7 Pooled Variance 522.35
8 Hypothesized Mean Difference 0
9 df 68
10 t Stat 0.90
11 P(T<=t) one-tail 0.1853
12 t Critical one-tail 1.6676
13 P(T<=t) two-tail 0.3705
14 t Critical two-tail 1.9955
t = .90, p-value = .1853. There is not enough evidence to infer that customers who see the ad and make a purchase
spend more than those who do not see the ad and make a purchase.
c z-estimator of p
p̂(1 − p̂)
p̂ ± z α / 2
n
A B C D E
1 z-Estimate of a Proportion
2
3 Sample proportion 0.4336 Confidence Interval Estimate
4 Sample size 113 0.4336 ± 0.0914
5 Confidence level 0.95 Lower confidence limit 0.3423
6 Upper confidence limit 0.5250
We estimate that between 34.23% and 52.50% of all customers who see the ad will make a purchase.
d t-estimator of μ
s
x ± tα/2
n
332
This edition is intended for use outside of the U.S. only, with content that may be different from the U.S. Edition. This may not be resold, copied,
or distributed without the prior consent of the publisher.
, A B C D
1 t-Estimate: Mean
2
3 Ad
4 Mean 97.38
5 Standard Deviation 24.94
6 LCL 90.22
7 UCL 104.55
We estimate that the mean amount spent by customers who see the ad and make a purchase lies between $90.22 and
$104.55.
A13.3 t-test of μ D
H0 :μD = 0
H1 : μ D > 0
xD −μD
t=
sD / n D
A B C
1 t-Test: Paired Two Sample for Means
2
3 Before After
4 Mean 381.00 373.12
5 Variance 39001 40663
6 Observations 25 25
7 Pearson Correlation 0.96
8 Hypothesized Mean Difference 0
9 df 24
10 t Stat 0.70
11 P(T<=t) one-tail 0.2438
12 t Critical one-tail 1.7109
13 P(T<=t) two-tail 0.4876
14 t Critical two-tail 2.0639
t = .70, p-value = .2438. There is not enough evidence to conclude that the equipment is effective.
A13.4 Frequency of accidents: z -test of p1 − p 2 (case 1)
H 0 : (p1 − p 2 ) = 0
H1 : (p1 − p 2 ) > 0
(p̂ 1 − p̂ 2 )
z=
⎛ 1 1 ⎞
p̂(1 − p̂)⎜⎜ + ⎟⎟
n
⎝ 1 n 2 ⎠
333
This edition is intended for use outside of the U.S. only, with content that may be different from the U.S. Edition. This may not be resold, copied,
or distributed without the prior consent of the publisher.
, A B C D E
1 z-Test of the Difference Between Two Proportions (Case 1)
2
3 Sample 1 Sample 2 z Stat 0.47
4 Sample proportion 0.0840 0.0760 P(Z<=z) one-tail 0.3205
5 Sample size 500 500 z Critical one-tail 1.6449
6 Alpha 0.05 P(Z<=z) two-tail 0.6410
7 z Critical two-tail 1.9600
z = .47, p-value = .32053. There is not enough evidence to infer that ABS-equipped cars have fewer accidents than
cars without ABS.
Severity of accidents Equal-variances t-test of μ 1 − μ 2
H 0 : (μ 1 − μ 2 ) = 0
H 1 : (μ 1 − μ 2 ) > 0
( x 1 − x 2 ) − (μ 1 − μ 2 )
t=
⎛ 1 1 ⎞
s 2p ⎜⎜ + ⎟⎟
n
⎝ 1 n 2 ⎠
A B C
1 t-Test: Two-Sample Assuming Equal Variances
2
3 No ABS ABS
4 Mean 2075 1714
5 Variance 450,343 390,409
6 Observations 42 38
7 Pooled Variance 421,913
8 Hypothesized Mean Difference 0
9 df 78
10 t Stat 2
11 P(T<=t) one-tail 0.0077
12 t Critical one-tail 1.6646
13 P(T<=t) two-tail 0.0153
14 t Critical two-tail 1.9908
Estimate of the difference between two means (equal-variances)
A B C D E F
1 t-Estimate of the Difference Between Two Means (Equal-Variances)
2
3 Sample 1 Sample 2 Confidence Interval Estimate
4 Mean 2075 1714 360.48 ± 290
5 Variance 450,343 390,409 Lower confidence limit 71
6 Sample size 42 38 Upper confidence limit 650
7 Pooled Variance 421,913
8 Confidence level 0.95
334
This edition is intended for use outside of the U.S. only, with content that may be different from the U.S. Edition. This may not be resold, copied,
or distributed without the prior consent of the publisher.