, A GUIDE TO STATISTICAL TECHNIQUES
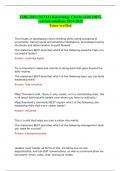
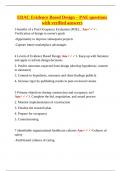
Problem Objectives
Analyze Relationship Analyze Relationship
Describe a Compare Two Compare Two or between Two among Two or More
Population Populations More Populations Variables Variables
Histogram Equal-variances t-test and estimator One-way analysis of variance Scatter diagram Multiple regression
Section 3.1 of the difference between two Section 14.1 Section 3.3 Chapter 17
Ogive means: independent samples LSD multiple comparison Covariance
Section 3.1 Section 13.1 method Section 4.4
Stem-and-leaf Unequal-variances t-test and Section 14.2 Coefficient of correlation
Section 3.1 estimator of the difference between Tukey’s multiple comparison Section 4.4
two means: independent samples method
Line chart Section 13.1 Coefficient of determination
Section 3.2 Section 14.2 Section 4.4
t-test and estimator of mean Two-way analysis of variance
Mean, median, and mode difference Least squares line
Section 4.1 Section 14.4 Section 4.4
Section 13.3
Range, variance, and Two-factor analysis of variance Simple linear regression and
F-test and estimator of ratio of two Section 14.5
standard deviation variances correlation
Section
ion 4.2 Chapter 16
Interval
Section 13.4
Percentiles and quartiles
Section 4.3
Box plot
Section 4.3
t-test and estimator of a mean
Section 12.1
Chi-squared test and
estimator of a variance
Section 12.2
Frequency distribution z-test and estimator of the Chi-squared test of a Chi-squared test of a contingency Not covered
Section 2.2 difference between two proportions contingency table table
DATA T YPES
Bar chart Section 13.5 Section 15.2 Section 15.2
Section 2.2 Chi-squared test of a contingency
Pie chart table
Section 2.2 Section 15.2
z-test and estimator
of a proportion
Nominal
Section 12.3
Chi-squared goodness-of-
fit test
Section 15.1
Median Not covered
Section 4.1
Percentiles and quartiles
Section 4.3
Box plot
Ordinal
Section 4.3
Copyright 2011 Cengage Learning. All Rights Reserved. May not be copied, scanned, or duplicated, in whole or in part. Due to electronic rights, some third party content may be suppressed from the eBook and/or eChapter(s).
Editorial review has deemed that any suppressed content does not materially affect the overall learning experience. Cengage Learning reserves the right to remove additional content at any time if subsequent rights restrictions require it.
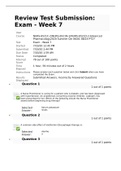
, AMERICAN NATIONAL ELECTION SURVEY AND GENERAL
SOCIAL SURVEY EXERCISES
Chapter ANES Page GSS Page
2 2.34–2.37 31
3 3.62–3.67 82 3.25–3.28 64
3.68–3.71 82
4 4.37–4.38 117 4.39 117
4.58–4.60 126 4.61–4.62 126
4.86 144 4.84–4.85 144
12 12.51–12.53 413 12.46–12.50 413
12.116–12.123 435 12.103–12.115 434
13 13.42–13.44 472 13.38–13.41 472
13.73 488 13.70–13.72 488
13.123–13.125 512 13.113–13.122 511
A13.27–A13.30 524 A13.18–A13.126 523
14 14.27–14.32 543 14.21–14.26 542
14.47–14.50 553 14.43–14.46 552
14.66–14.67 563
A14.23–A14.25 594 A14.19–A14.22 594
15 15.17 604 15.18–15.21 604
15.43–15.46 615 15.39–15.42 614
A15.25–A15.28 631 A15.17–A15.24 630
16 16.45–16.49 665 16.50–16.53 666
16.73–16.76 671 16.77–16.80 671
A16.27–A16.28 689 A16.17–A16.26 689
17 17.21–17.22 713 17.16–17.20 712
A17.27–A17.28 734 A17.17–A17.26 733
APPLICATION SECTIONS
Section 4.5 (Optional) Application in Professional Sports Management: Determinants of the Number
of Wins in a Baseball Season (illustrating an application of the least squares method and
correlation) 144
Section 4.6 (Optional) Application in Finance: Market Model (illustrating using a least squares lines and
coefficient of determination to estimate a stock’s market-related risk and its firm-specific risk) 147
Section 7.3 (Optional) Application in Finance: Portfolio Diversification and Asset Allocation (illustrating
the laws of expected value and variance and covariance) 237
Section 12.4 (Optional) Application in Marketing: Market Segmentation (using inference about a proportion
to estimate the size of a market segment) 435
Section 14.6 (Optional) Application in Operations Management: Finding and Reducing Variation (using
analysis of variance to actively experiment to find sources of variation) 578
APPLICATION SUBSECTION
Section 6.4 (Optional) Application in Medicine and Medical Insurance: Medical Screening (using Bayes’s
Law to calculate probabilities after a screening test) 199
Copyright 2011 Cengage Learning. All Rights Reserved. May not be copied, scanned, or duplicated, in whole or in part. Due to electronic rights, some third party content may be suppressed from the eBook and/or eChapter(s).
Editorial review has deemed that any suppressed content does not materially affect the overall learning experience. Cengage Learning reserves the right to remove additional content at any time if subsequent rights restrictions require it.
, This page intentionally left blank
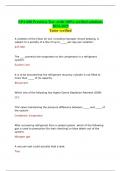
Problem Objectives
Analyze Relationship Analyze Relationship
Describe a Compare Two Compare Two or between Two among Two or More
Population Populations More Populations Variables Variables
Histogram Equal-variances t-test and estimator One-way analysis of variance Scatter diagram Multiple regression
Section 3.1 of the difference between two Section 14.1 Section 3.3 Chapter 17
Ogive means: independent samples LSD multiple comparison Covariance
Section 3.1 Section 13.1 method Section 4.4
Stem-and-leaf Unequal-variances t-test and Section 14.2 Coefficient of correlation
Section 3.1 estimator of the difference between Tukey’s multiple comparison Section 4.4
two means: independent samples method
Line chart Section 13.1 Coefficient of determination
Section 3.2 Section 14.2 Section 4.4
t-test and estimator of mean Two-way analysis of variance
Mean, median, and mode difference Least squares line
Section 4.1 Section 14.4 Section 4.4
Section 13.3
Range, variance, and Two-factor analysis of variance Simple linear regression and
F-test and estimator of ratio of two Section 14.5
standard deviation variances correlation
Section
ion 4.2 Chapter 16
Interval
Section 13.4
Percentiles and quartiles
Section 4.3
Box plot
Section 4.3
t-test and estimator of a mean
Section 12.1
Chi-squared test and
estimator of a variance
Section 12.2
Frequency distribution z-test and estimator of the Chi-squared test of a Chi-squared test of a contingency Not covered
Section 2.2 difference between two proportions contingency table table
DATA T YPES
Bar chart Section 13.5 Section 15.2 Section 15.2
Section 2.2 Chi-squared test of a contingency
Pie chart table
Section 2.2 Section 15.2
z-test and estimator
of a proportion
Nominal
Section 12.3
Chi-squared goodness-of-
fit test
Section 15.1
Median Not covered
Section 4.1
Percentiles and quartiles
Section 4.3
Box plot
Ordinal
Section 4.3
Copyright 2011 Cengage Learning. All Rights Reserved. May not be copied, scanned, or duplicated, in whole or in part. Due to electronic rights, some third party content may be suppressed from the eBook and/or eChapter(s).
Editorial review has deemed that any suppressed content does not materially affect the overall learning experience. Cengage Learning reserves the right to remove additional content at any time if subsequent rights restrictions require it.
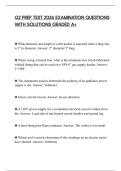
, AMERICAN NATIONAL ELECTION SURVEY AND GENERAL
SOCIAL SURVEY EXERCISES
Chapter ANES Page GSS Page
2 2.34–2.37 31
3 3.62–3.67 82 3.25–3.28 64
3.68–3.71 82
4 4.37–4.38 117 4.39 117
4.58–4.60 126 4.61–4.62 126
4.86 144 4.84–4.85 144
12 12.51–12.53 413 12.46–12.50 413
12.116–12.123 435 12.103–12.115 434
13 13.42–13.44 472 13.38–13.41 472
13.73 488 13.70–13.72 488
13.123–13.125 512 13.113–13.122 511
A13.27–A13.30 524 A13.18–A13.126 523
14 14.27–14.32 543 14.21–14.26 542
14.47–14.50 553 14.43–14.46 552
14.66–14.67 563
A14.23–A14.25 594 A14.19–A14.22 594
15 15.17 604 15.18–15.21 604
15.43–15.46 615 15.39–15.42 614
A15.25–A15.28 631 A15.17–A15.24 630
16 16.45–16.49 665 16.50–16.53 666
16.73–16.76 671 16.77–16.80 671
A16.27–A16.28 689 A16.17–A16.26 689
17 17.21–17.22 713 17.16–17.20 712
A17.27–A17.28 734 A17.17–A17.26 733
APPLICATION SECTIONS
Section 4.5 (Optional) Application in Professional Sports Management: Determinants of the Number
of Wins in a Baseball Season (illustrating an application of the least squares method and
correlation) 144
Section 4.6 (Optional) Application in Finance: Market Model (illustrating using a least squares lines and
coefficient of determination to estimate a stock’s market-related risk and its firm-specific risk) 147
Section 7.3 (Optional) Application in Finance: Portfolio Diversification and Asset Allocation (illustrating
the laws of expected value and variance and covariance) 237
Section 12.4 (Optional) Application in Marketing: Market Segmentation (using inference about a proportion
to estimate the size of a market segment) 435
Section 14.6 (Optional) Application in Operations Management: Finding and Reducing Variation (using
analysis of variance to actively experiment to find sources of variation) 578
APPLICATION SUBSECTION
Section 6.4 (Optional) Application in Medicine and Medical Insurance: Medical Screening (using Bayes’s
Law to calculate probabilities after a screening test) 199
Copyright 2011 Cengage Learning. All Rights Reserved. May not be copied, scanned, or duplicated, in whole or in part. Due to electronic rights, some third party content may be suppressed from the eBook and/or eChapter(s).
Editorial review has deemed that any suppressed content does not materially affect the overall learning experience. Cengage Learning reserves the right to remove additional content at any time if subsequent rights restrictions require it.
, This page intentionally left blank