P6: Report findings and conclusions from the research project
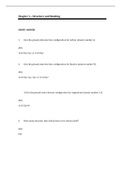
Gender
Male Female
12.50%
87.50%
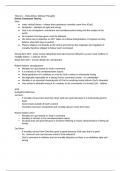
In this pie chart we can see that there were more females than males that took part in the
study. Overall, 24 students took part in the study, 3 of which were male and 21 of which were
female.
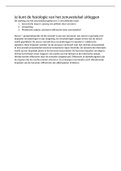
A ge
16 17 18 19 20 21+
4.17%
12.50%
4.17%
12.50%
41.67%
25.00%
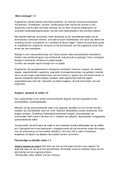
In this pie chart we can see that the participants who took part in the study all had different
ages. 1 participant was 16, 10 were 17, 6 were 18, 3 were 19, 1 was 20 and 3 were 21+. This
includes both the male and female participants.
Unit 22 1
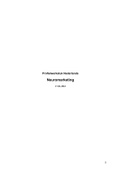
Gender
Male Female
12.50%
87.50%
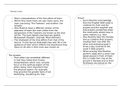
In this pie chart we can see that there were more females than males that took part in the
study. Overall, 24 students took part in the study, 3 of which were male and 21 of which were
female.
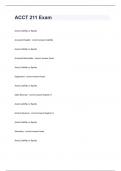
A ge
16 17 18 19 20 21+
4.17%
12.50%
4.17%
12.50%
41.67%
25.00%
In this pie chart we can see that the participants who took part in the study all had different
ages. 1 participant was 16, 10 were 17, 6 were 18, 3 were 19, 1 was 20 and 3 were 21+. This
includes both the male and female participants.
Unit 22 1