Quiz Submissions - Final Review
point
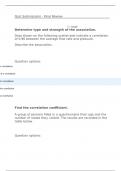
Determine type and strength of the association.
Data shown on the following scatter-plot indicate a correlation
of 0.96 between the average flow rate and pressure.
Describe the association.
Question options:
ve correlation
of a correlation
ive correlation
ive correlation
ve correlation
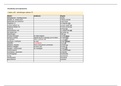
Find the correlation coefficient.
A group of persons filled in a questionnaire their age and the
number of states they visited. The results are recorded in the
table below.
Question options:
, Interpret the correlation coefficient.
The correlation between a person’s annual income and debt level is high and positive.
Therefore, it can be concluded that:
Question options:
igher annual incomes tend to have more debt.
ge enough incomes do not have any debt.
me will cause a person to go into debt.
her annual incomes tend to have less debt.
Determine the point estimate.
It has been determined with 95% confidence that the
proportion of Americans who eat turkey on Thanksgiving is
between 0.78 and 0.82.
Determine the sample proportion that was used to build this
confidence interval.
Question options:
, Determine the specified confidence interval.
It has been estimated, with 90% confidence, the proportion of Americans
who go out shopping on Black Friday is 0.40 with a margin of error equal
to 0.04.
Determine the resulting 90% confidence interval for the proportion of
Americans who go out shopping on Black Friday.
Question options:
Construct the equation of the regression line.
An editing firm compiled the following table which lists the
number of pages contained in a piece of technical writing and
the cost of proofreading and correcting them (in dollars).
Assume there is a significant linear relationship between X and
Y and construct the equation of the linear regression line.
point
Determine type and strength of the association.
Data shown on the following scatter-plot indicate a correlation
of 0.96 between the average flow rate and pressure.
Describe the association.
Question options:
ve correlation
of a correlation
ive correlation
ive correlation
ve correlation
Find the correlation coefficient.
A group of persons filled in a questionnaire their age and the
number of states they visited. The results are recorded in the
table below.
Question options:
, Interpret the correlation coefficient.
The correlation between a person’s annual income and debt level is high and positive.
Therefore, it can be concluded that:
Question options:
igher annual incomes tend to have more debt.
ge enough incomes do not have any debt.
me will cause a person to go into debt.
her annual incomes tend to have less debt.
Determine the point estimate.
It has been determined with 95% confidence that the
proportion of Americans who eat turkey on Thanksgiving is
between 0.78 and 0.82.
Determine the sample proportion that was used to build this
confidence interval.
Question options:
, Determine the specified confidence interval.
It has been estimated, with 90% confidence, the proportion of Americans
who go out shopping on Black Friday is 0.40 with a margin of error equal
to 0.04.
Determine the resulting 90% confidence interval for the proportion of
Americans who go out shopping on Black Friday.
Question options:
Construct the equation of the regression line.
An editing firm compiled the following table which lists the
number of pages contained in a piece of technical writing and
the cost of proofreading and correcting them (in dollars).
Assume there is a significant linear relationship between X and
Y and construct the equation of the linear regression line.