WGU C955 PROBABILITY AND STATISTICS
OBJECTIVE ASSESSMENT EXAM(ACTUAL
2024-2025) WITH ANSWERS.
A researcher is interested in determining purchasing
preferences based on age. The researcher randomly samples
people in two age groups and asks how they prefer to shop.
Conditional percentages are used to summarize the responses
in the table below:
Purchasing Preferences
..............Online..In-Store..Total
40 and above..45%.....55%.......100%
39 and below..63%.....37%.......100%
Total.........54%.....46%.......100%
Based on this information, what is the relationship between
age and shopping preference?
A) People aged 40 and above prefer shopping in-store more
than people aged 39 and below because 55% is greater than
45%.
B) People aged 40 and above prefer shopping in-store more
than people aged 39 and below because 55% is greater than
37%.
C) People aged 39 and below prefer shopping in-store more
than people aged 40 and above because 63% is greater than
46%.
D) People aged 39 and below prefer shopping in-st -
ANSWERS___People aged 40 and above prefer shopping in-
, WGU C955 PROBABILITY AND STATISTICS
OBJECTIVE ASSESSMENT EXAM(ACTUAL
2024-2025) WITH ANSWERS.
store more than people aged 39 and below because 55% is
greater than 37%.
The percentage of drivers born before and after 1990 who can
and cannot drive manual transmission is recorded in the table
below:
Results......Can Drive Manual..Cannot Drive Manual..Total
Before 1990..78%...............22%..................100%
After 1990...16%...............84%..................100%
What is the relationship between the time period drivers were
born in and the ability to drive a manual transmission car?
A) People born before 1990 are more likely to be able to drive
a manual transmission car than people born after 1990
because 78% is greater than 16%.
B) People born after 1990 are less likely to be able to drive a
manual transmission car than people born before 1990
because 22% is less than 78%.
C) People born before 1990 are more likely to be able to drive
a manual transmission car than people born after 1990
because 78% is greater than 22%.
,WGU C955 PROBABILITY AND STATISTICS
OBJECTIVE ASSESSMENT EXAM(ACTUAL
2024-2025) WITH ANSWERS.
D) People born after 1990 are less likely to be abl -
ANSWERS___People born before 1990 are more likely to be
able to drive a manual transmission car than people born after
1990 because 78% is greater than 16%.
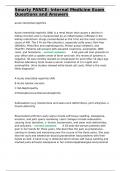
Which type of correlation is shown in the scatterplot below?
{{ Scatterplot starting from point (10.9,13.5) to (14.6,15.2) }}
A) Positive correlation
B) Negative correlation
C) Nonlinear correlation
D) No correlation - ANSWERS___Positive correlation
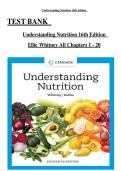
{{ Scatterplot starting from point (0.2,3.58) to (1.5,3.43)
where all follow a close path down and to the left }}
Which type of correlation is shown in the scatterplot above?
A) Strong negative linear correlation
B) Strong positive linear correlation
C) Weak positive linear correlation
, WGU C955 PROBABILITY AND STATISTICS
OBJECTIVE ASSESSMENT EXAM(ACTUAL
2024-2025) WITH ANSWERS.
D) Weak negative linear correlation - ANSWERS___Strong
negative linear correlation
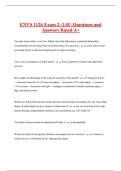
The scatterplot below depicts data of hours spent watching
TV by age:
{{ Scatterplot where the points appear to be random }}
What is the most likely correlation coefficient?
A) −5
B) −1
C) 0
D) 1 - ANSWERS___0
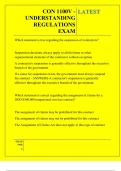
How will removal of the outlier affect the relationship
between missed work days and health rating in the scatterplot
below?
{{ Scatterplot trending down and to the left with an outlier
below the surrounding points }}
A) It will weaken the positive relationship.
OBJECTIVE ASSESSMENT EXAM(ACTUAL
2024-2025) WITH ANSWERS.
A researcher is interested in determining purchasing
preferences based on age. The researcher randomly samples
people in two age groups and asks how they prefer to shop.
Conditional percentages are used to summarize the responses
in the table below:
Purchasing Preferences
..............Online..In-Store..Total
40 and above..45%.....55%.......100%
39 and below..63%.....37%.......100%
Total.........54%.....46%.......100%
Based on this information, what is the relationship between
age and shopping preference?
A) People aged 40 and above prefer shopping in-store more
than people aged 39 and below because 55% is greater than
45%.
B) People aged 40 and above prefer shopping in-store more
than people aged 39 and below because 55% is greater than
37%.
C) People aged 39 and below prefer shopping in-store more
than people aged 40 and above because 63% is greater than
46%.
D) People aged 39 and below prefer shopping in-st -
ANSWERS___People aged 40 and above prefer shopping in-
, WGU C955 PROBABILITY AND STATISTICS
OBJECTIVE ASSESSMENT EXAM(ACTUAL
2024-2025) WITH ANSWERS.
store more than people aged 39 and below because 55% is
greater than 37%.
The percentage of drivers born before and after 1990 who can
and cannot drive manual transmission is recorded in the table
below:
Results......Can Drive Manual..Cannot Drive Manual..Total
Before 1990..78%...............22%..................100%
After 1990...16%...............84%..................100%
What is the relationship between the time period drivers were
born in and the ability to drive a manual transmission car?
A) People born before 1990 are more likely to be able to drive
a manual transmission car than people born after 1990
because 78% is greater than 16%.
B) People born after 1990 are less likely to be able to drive a
manual transmission car than people born before 1990
because 22% is less than 78%.
C) People born before 1990 are more likely to be able to drive
a manual transmission car than people born after 1990
because 78% is greater than 22%.
,WGU C955 PROBABILITY AND STATISTICS
OBJECTIVE ASSESSMENT EXAM(ACTUAL
2024-2025) WITH ANSWERS.
D) People born after 1990 are less likely to be abl -
ANSWERS___People born before 1990 are more likely to be
able to drive a manual transmission car than people born after
1990 because 78% is greater than 16%.
Which type of correlation is shown in the scatterplot below?
{{ Scatterplot starting from point (10.9,13.5) to (14.6,15.2) }}
A) Positive correlation
B) Negative correlation
C) Nonlinear correlation
D) No correlation - ANSWERS___Positive correlation
{{ Scatterplot starting from point (0.2,3.58) to (1.5,3.43)
where all follow a close path down and to the left }}
Which type of correlation is shown in the scatterplot above?
A) Strong negative linear correlation
B) Strong positive linear correlation
C) Weak positive linear correlation
, WGU C955 PROBABILITY AND STATISTICS
OBJECTIVE ASSESSMENT EXAM(ACTUAL
2024-2025) WITH ANSWERS.
D) Weak negative linear correlation - ANSWERS___Strong
negative linear correlation
The scatterplot below depicts data of hours spent watching
TV by age:
{{ Scatterplot where the points appear to be random }}
What is the most likely correlation coefficient?
A) −5
B) −1
C) 0
D) 1 - ANSWERS___0
How will removal of the outlier affect the relationship
between missed work days and health rating in the scatterplot
below?
{{ Scatterplot trending down and to the left with an outlier
below the surrounding points }}
A) It will weaken the positive relationship.