Exercise 31: Calculating t-Test for Independent
Samples - SPSS Output (Exercise 31 Student
Version.)
1. Do the example data meet the assumptions for the independent samples t-test? Provide a
rationale for your answer The date that is provided does in fact meet all the criteria. The
assumptions being the variable measured on a continuous or ordinal scale, the sample
random, the sample size is big enough, normal distribution is seen when the data is
plotted, and there is homogeneity of variance
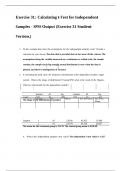
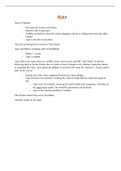
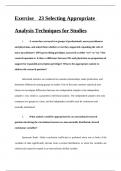
2. If calculating by hand, draw the frequency distributions of the dependent variable, wages
earned. What is the shape of distribution? If using SPSS, what is the result of the Shapiro-
Wilk test of normality for the dependent variable?
Statistic df Sig. statistic df Sig.
wages .193 10 .200 .914 10 .311
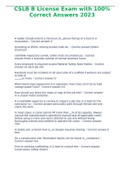
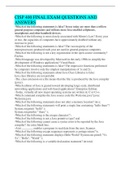
Group N Mean Std. Deviation Std. Error
The shape of the distribution is standard
Mean
Support 1 10 128.40 43.025 13.606
2 10 232.70 65.324 20.657
The mean for the treatment group is 232.70. The control group mean is $128.40
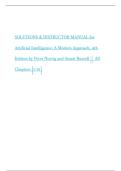
4. What is the independent samples t-test value? The independent T-test value is -4.217
Samples - SPSS Output (Exercise 31 Student
Version.)
1. Do the example data meet the assumptions for the independent samples t-test? Provide a
rationale for your answer The date that is provided does in fact meet all the criteria. The
assumptions being the variable measured on a continuous or ordinal scale, the sample
random, the sample size is big enough, normal distribution is seen when the data is
plotted, and there is homogeneity of variance
2. If calculating by hand, draw the frequency distributions of the dependent variable, wages
earned. What is the shape of distribution? If using SPSS, what is the result of the Shapiro-
Wilk test of normality for the dependent variable?
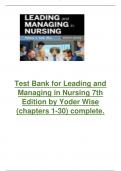
Statistic df Sig. statistic df Sig.
wages .193 10 .200 .914 10 .311
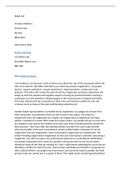
Group N Mean Std. Deviation Std. Error
The shape of the distribution is standard
Mean
Support 1 10 128.40 43.025 13.606
2 10 232.70 65.324 20.657
The mean for the treatment group is 232.70. The control group mean is $128.40
4. What is the independent samples t-test value? The independent T-test value is -4.217